![AccountAbility_logo_primary_fullcolor-1.png]](https://knowledgebase.counta.com/hs-fs/hubfs/AccountAbility_logo_primary_fullcolor-1.png?height=40&name=AccountAbility_logo_primary_fullcolor-1.png)
Step by Step Guide:
Tip: By default, financial statements in Counta follow your agency's account structure. If you need a format that's different from the default structure, e.g. Management Summary version, you can create a custom financial statement format within the Platform.
1. To create your custom balance sheet or P&L. Navigate to ACCOUNTING> General Ledger > General Ledger Accounts
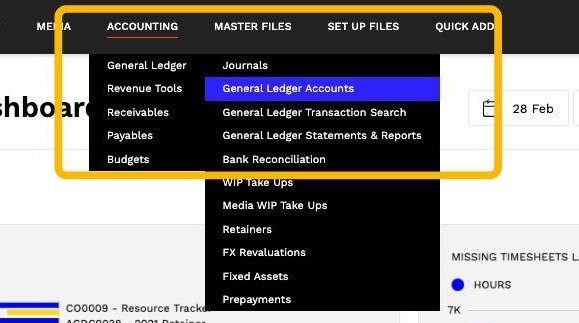
2. Click on Financial Report Formats
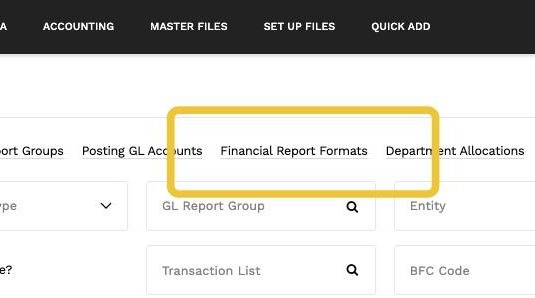
3. You will be directed to the financial report formats search page, where you can view any existing report formats that have been set up.
To create a new financial report format, click New Financial Report Format.
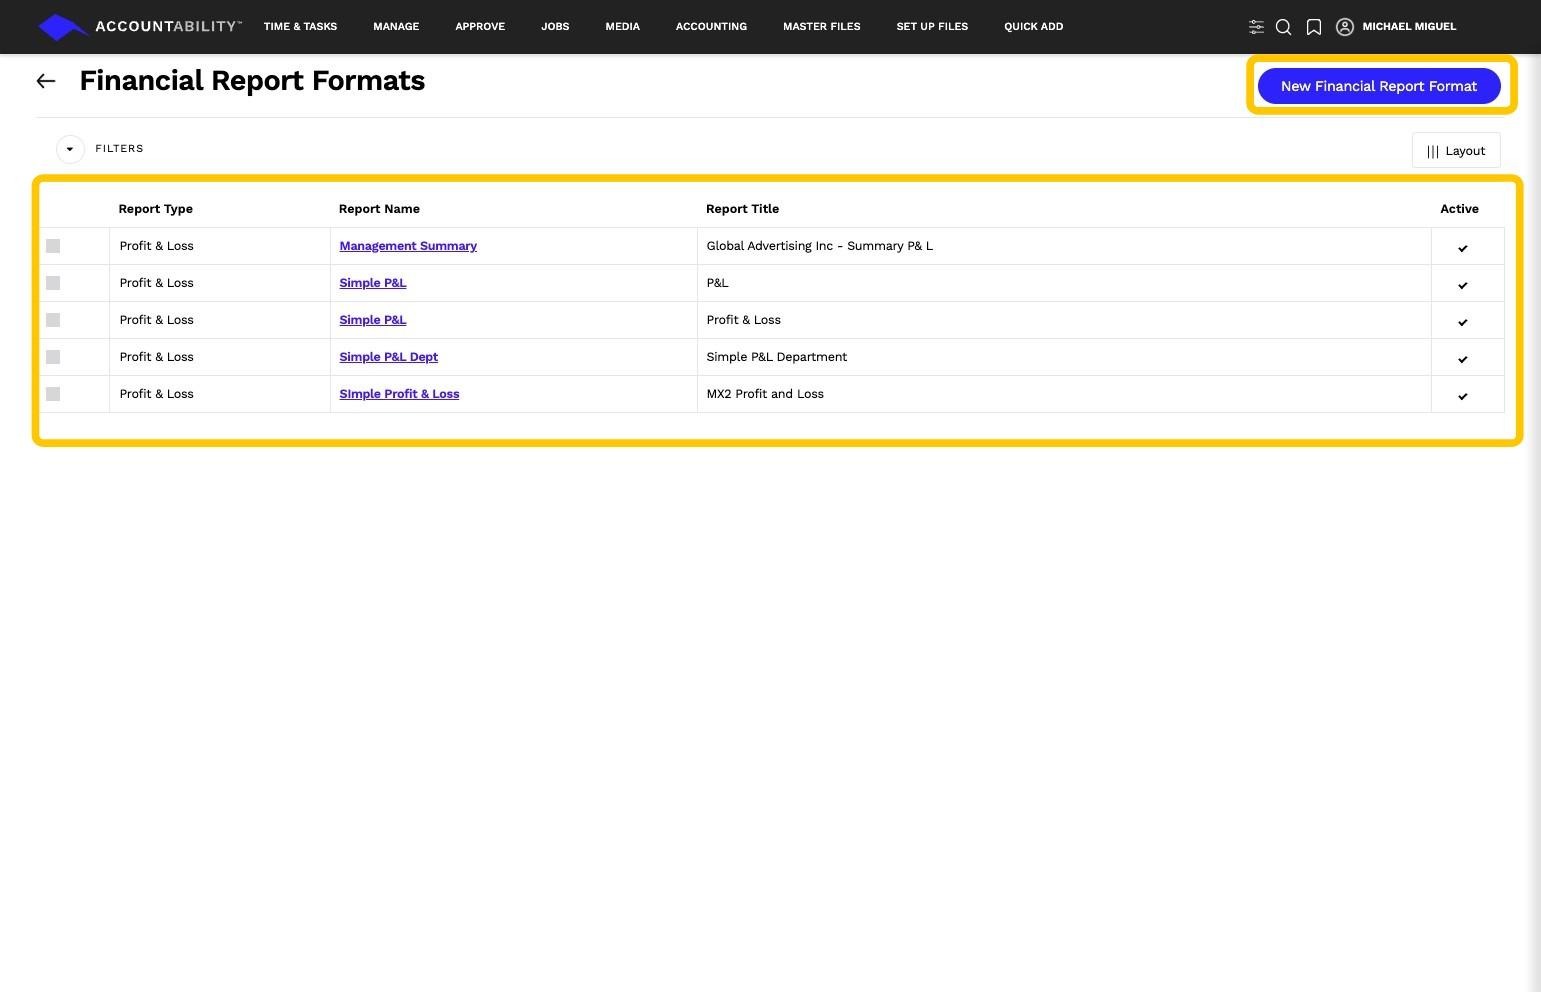
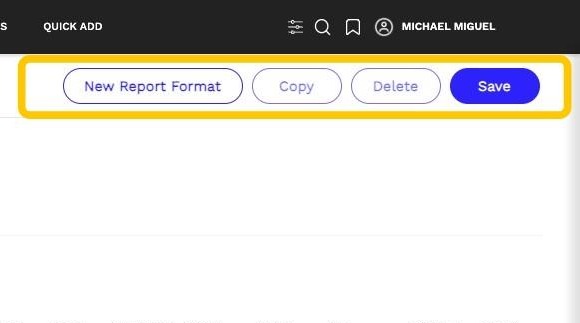
4. Let’s explore the Financial Report Format page. In the top-right corner, you’ll find four action buttons:
- New Report Format – Create a new financial report.
- Copy – Duplicate an existing report format.
- Delete – Remove a selected report format.
- Save – Save your current report progress.
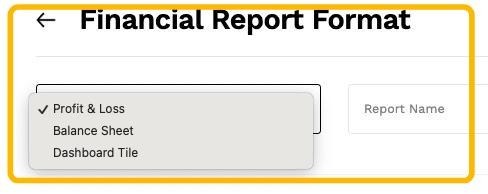
5. You can create a new financial report using one of three types:
- Profit & Loss
- Balance Sheet
- Dashboard Tile
6. You can customize your financial report by setting a report name and report title. Use the Active checkbox to specify whether the report format is enabled.
To add more lines to your financial report template, click the More Lines button.
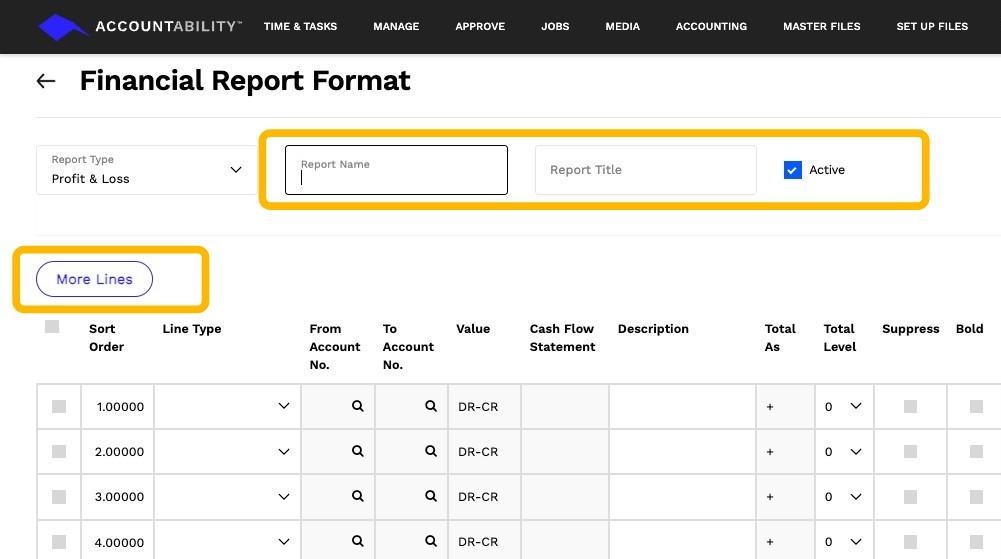
Tip: Tip: As you create your custom financial report, additional lines will be automatically added when you reach the end of the table—just click "Save" to generate more lines.
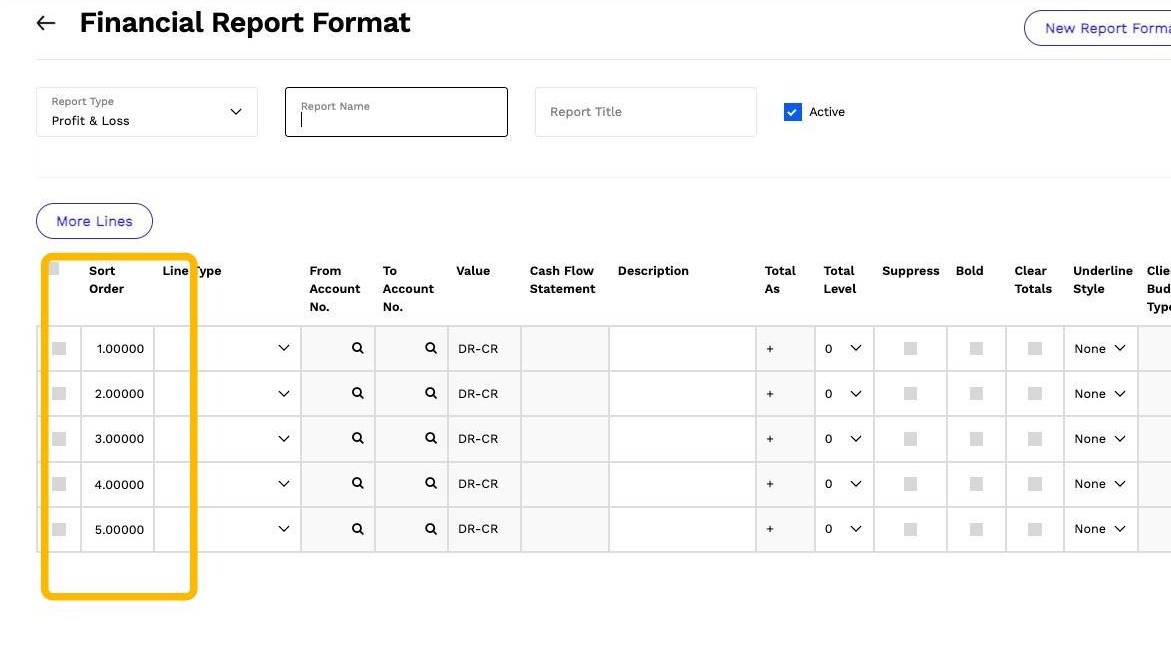
7. In the middle of the page, you'll find the Report Builder. Let’s go over the table from left to right:
Sort Order – This determines the sequence in which your report items appear. You can insert items between existing numbers using decimals (e.g., 1.1, 1.2) to maintain a logical order.
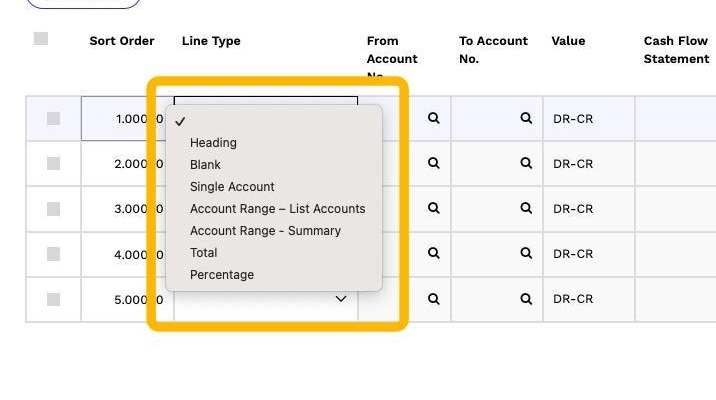
8. Line Type Options
The Line Type setting determines how each line item appears in your financial report. Here are the available options:
- Heading – Creates a main heading or subheading to organize your report.
- Blank – Inserts an empty line to add spacing between sections.
- Single Account – Displays a specific account from your general ledger.
- Account Range List – Lists multiple general ledger (GL) accounts within a specified range.
- Account Range – Summary – Summarizes all accounts within a defined range into a single line.
- Total – Calculates and displays the sum of selected accounts.
- Percentage – Shows the percentage of a selected account relative to a total.
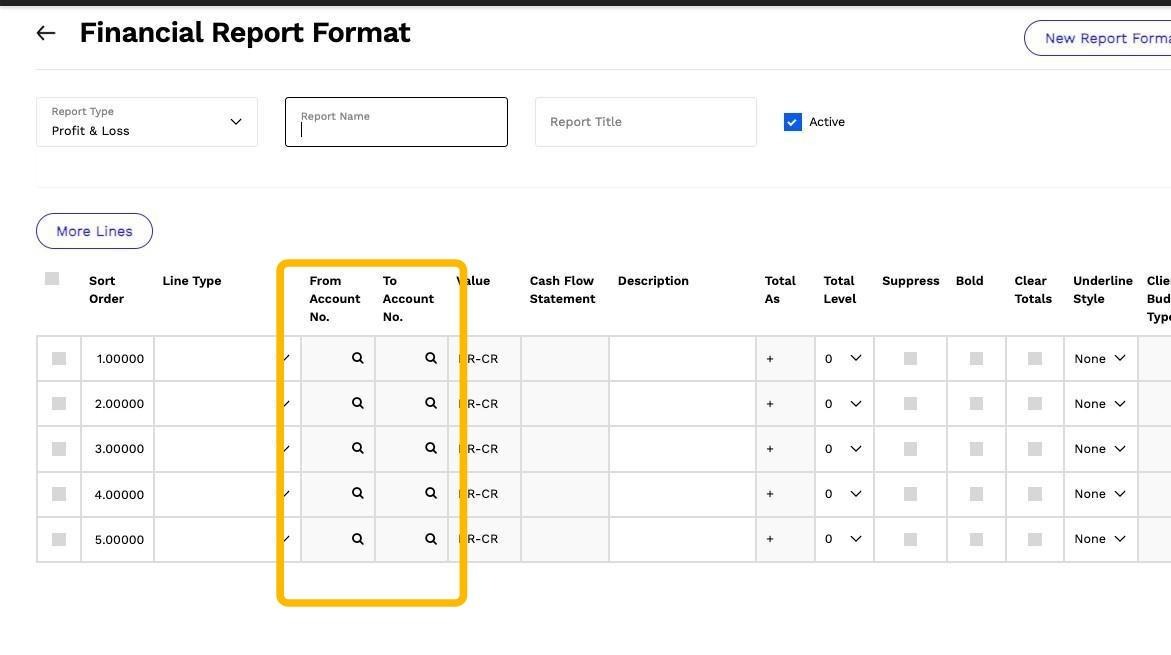
9. The From Account No and To Account No fields define the range of GL accounts from your chart of accounts to be included in the report. This allows you to pull in specific accounts or a range of accounts as needed.
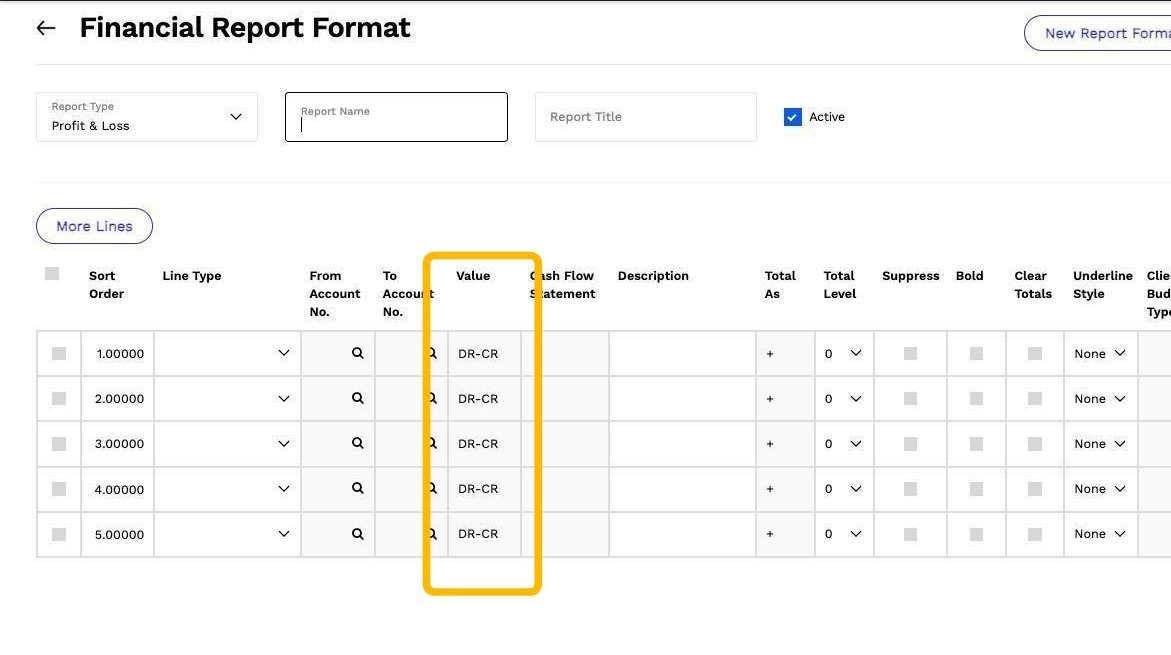
10. The Value field defines how amounts are calculated for the report line item. You can specify whether the value is displayed as debit minus credit or credit minus debit, depending on how you want financial data to be presented in your Balance Sheet or Profit & Loss statement.
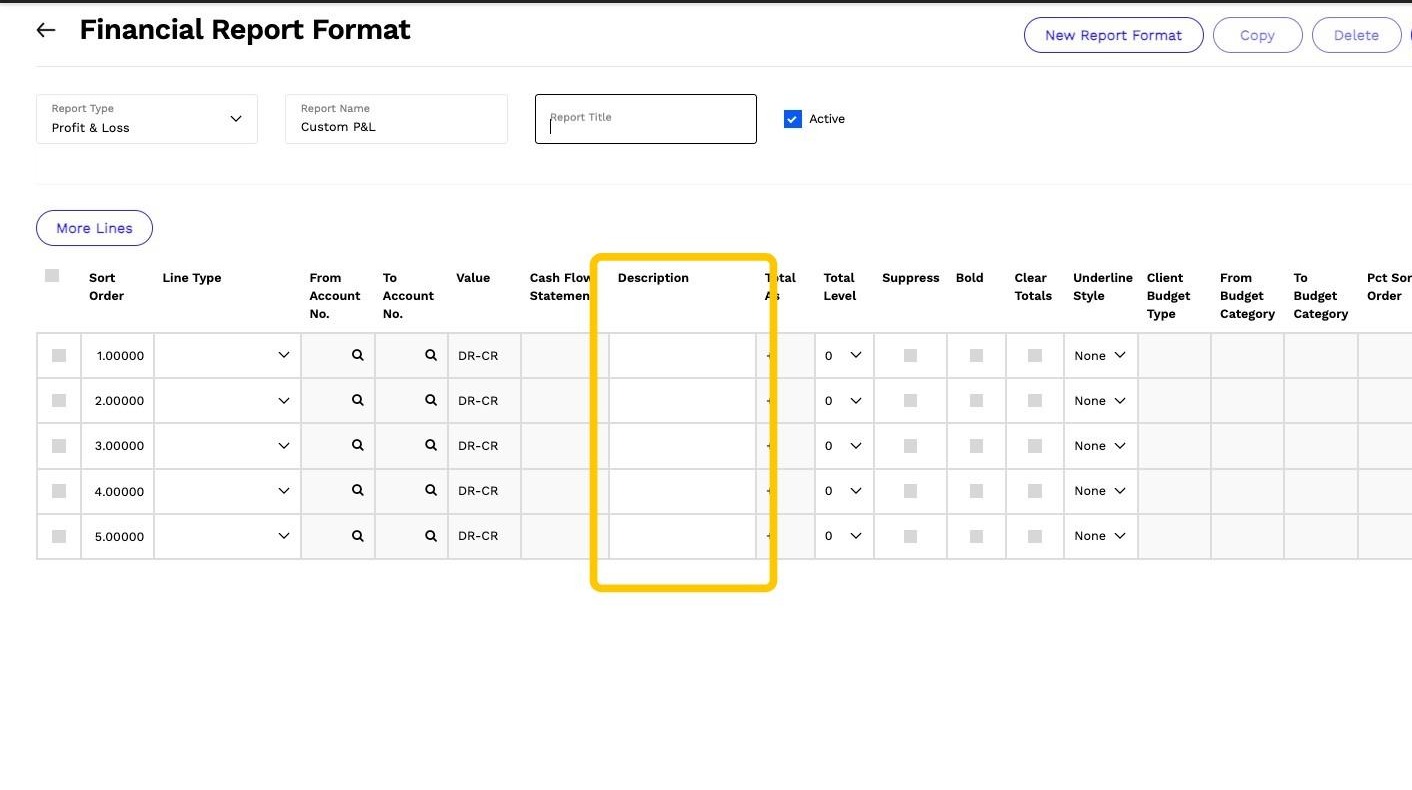
11. You can customize descriptions for the following line types:
- Heading – Define section headers or subheadings within the report.
- Total – Label total calculations for clarity.
- Percentage – Specify how percentage values should be described.
For Single Account line types, the system automatically pulls in the GL account description. When using the Account Range – Summary line type, you can manually enter a custom description to represent the summarized accounts.
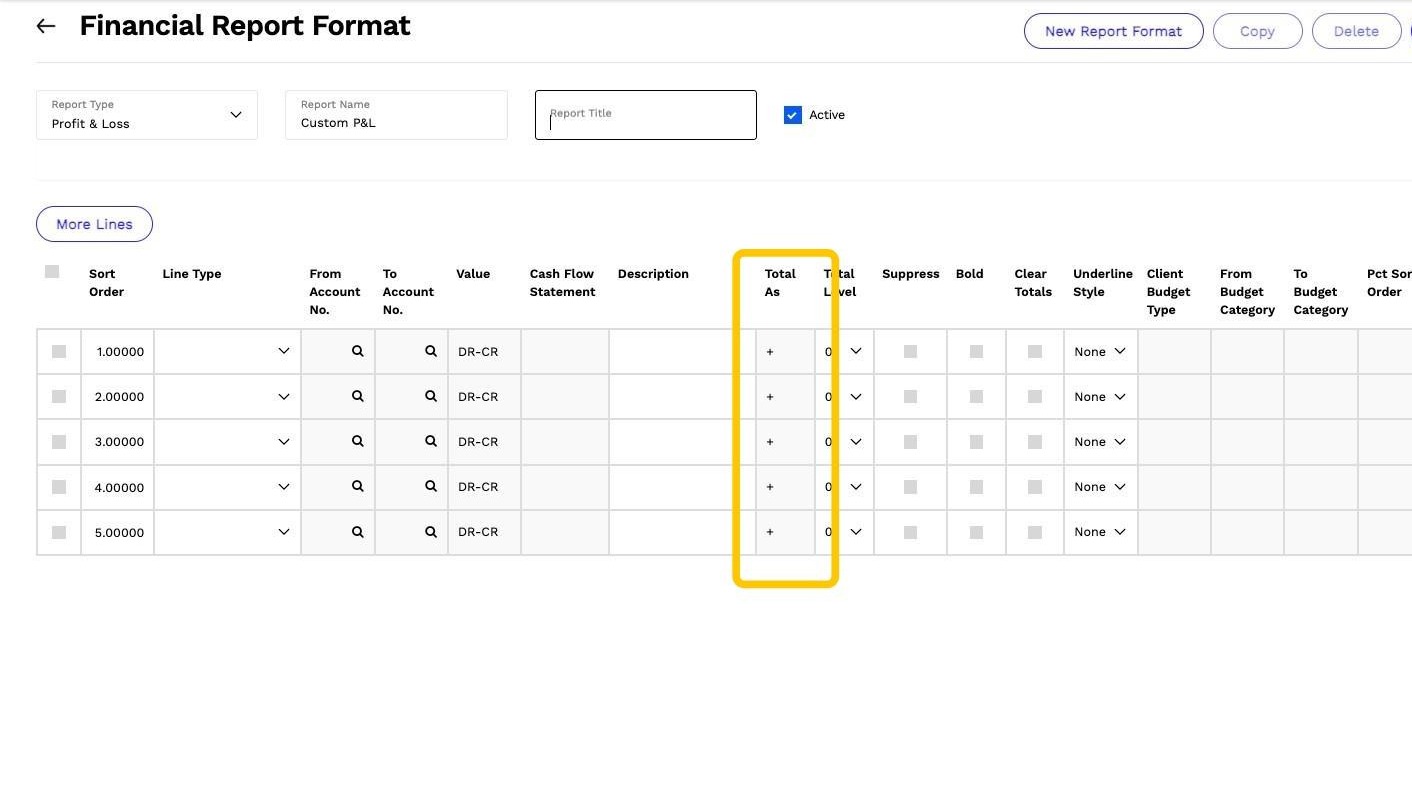
12. Total As (+ / -) Field
The Total As field controls how amounts are factored into the report’s totals. You can set this field to either + (positive) or - (negative) to adjust how the value impacts the overall calculation.
- (+) Positive – Includes the amount in the total as-is. Use this for revenue, assets, or any values that should contribute positively.
- (-) Negative – Subtracts the amount from the total. This is useful for expenses, liabilities, or adjustments that reduce the overall figure.
This setting ensures financial reports accurately reflect your agency’s revenue, costs, and profitability at a glance.
13. Total Level Field
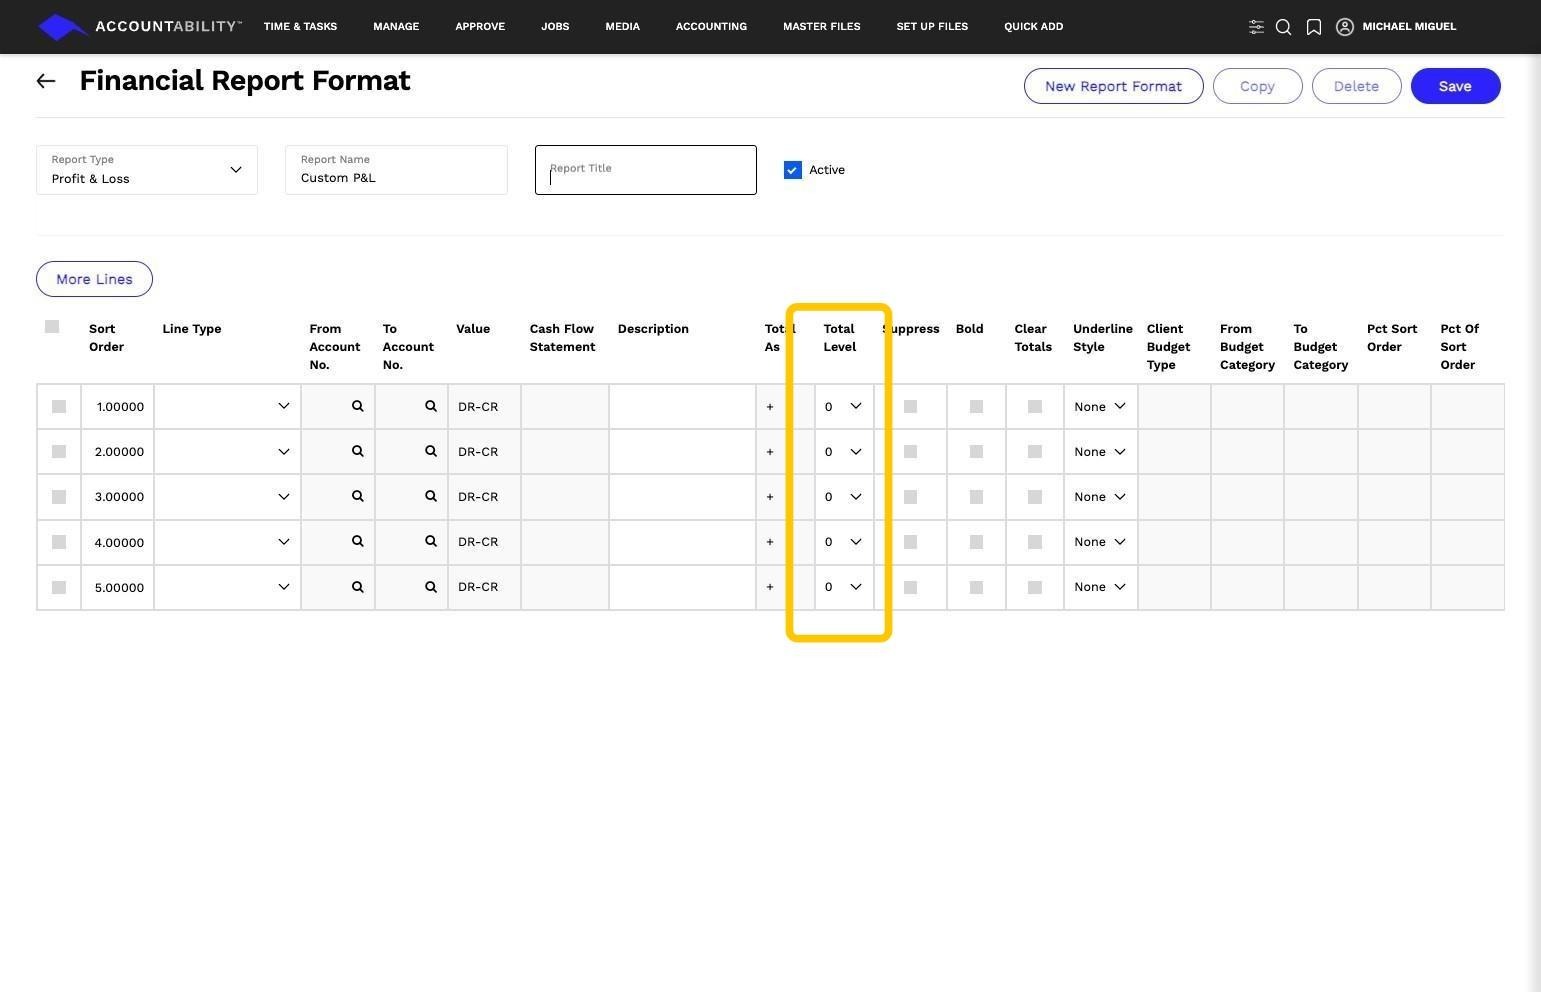
The Total Level field determines the hierarchy of a total within the report structure. It defines which lines are summed together, ensuring accurate roll-ups of financial data.
- Level 1 – The highest-level total, summing all applicable lines above it.
- Level 2, 3, 4, etc. – Subtotals within different sections. For example:
- Level 2 totals a subset of lines before rolling into a higher-level total.
- Level 3+ is used for deeper breakdowns, calculating nested subtotals.
This structure helps create clear, organized financial reports, ensuring totals are properly grouped for analysis.
14. Report Formatting Options
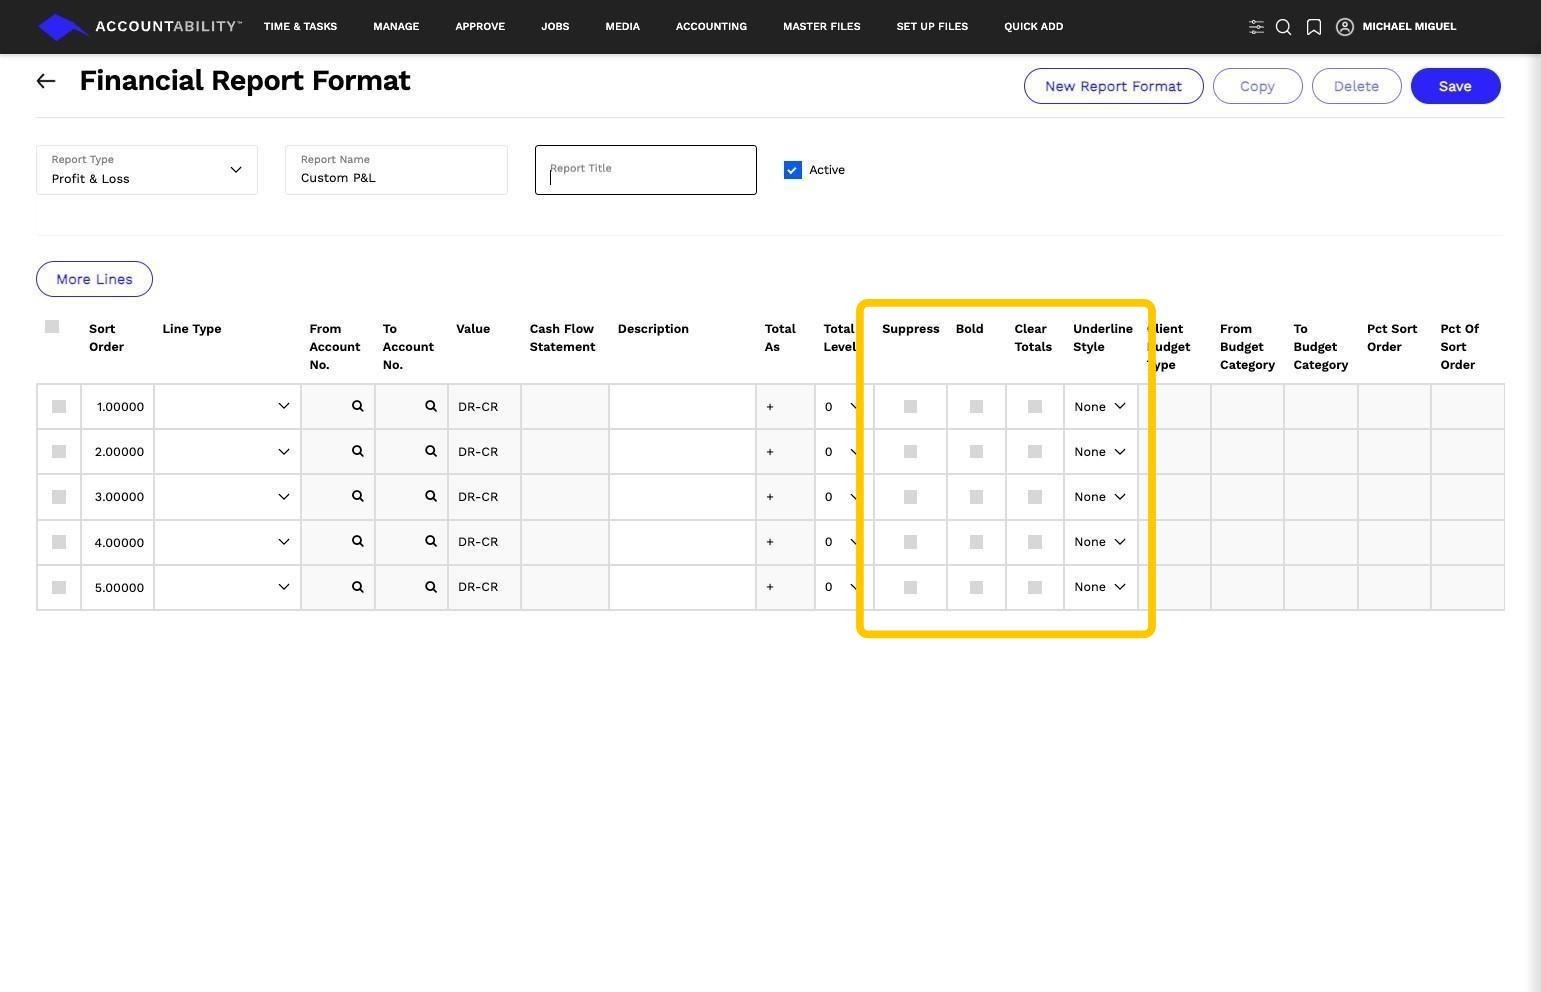
Customize how your financial report appears with the following options:
- Suppress – Hides the report line so it won’t be displayed in the final report. Use this to remove unnecessary details without deleting data.
- Bold – Highlights important figures or section headings by making the text bold.
- Clear Totals – Resets the total at this line, preventing it from rolling up into higher-level calculations. This is useful for breaking out key financial sections.
- Underline Style – Controls how lines are visually separated in the report:
- None – No underline.
- Single – A standard underline for emphasis, often used for subtotals.
- Double – A double underline, typically used for grand totals or final figures.
These options help you design a clean, professional report that makes key financial data easy to analyze.
Step-by-Step Guide: Creating a Custom Profit & Loss Report
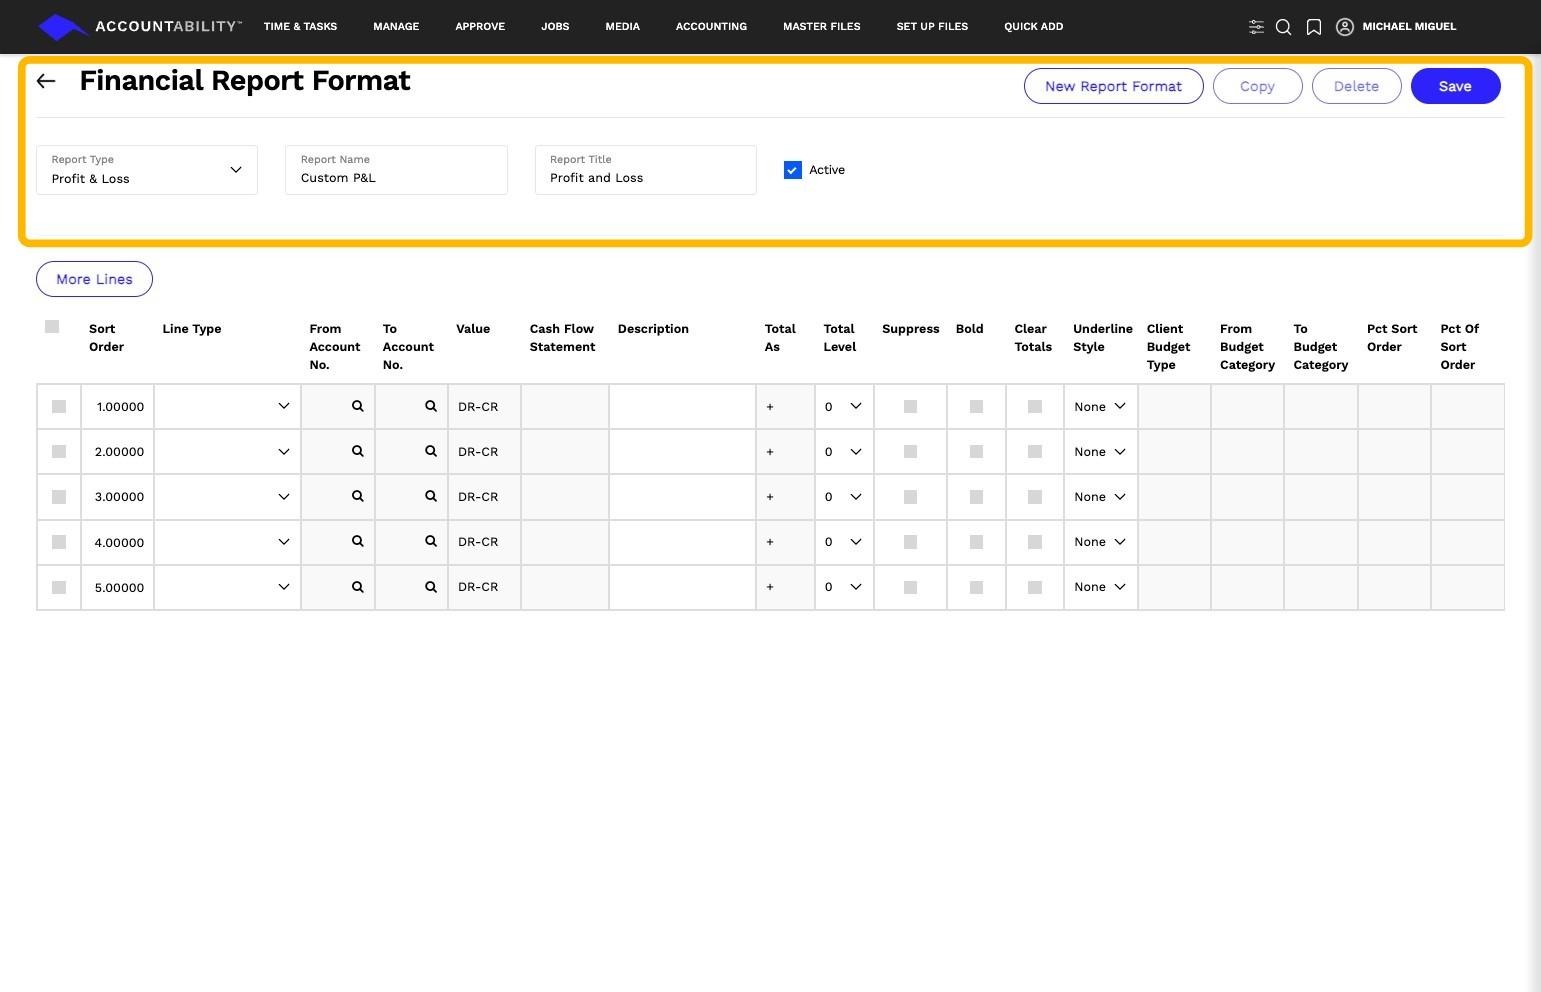
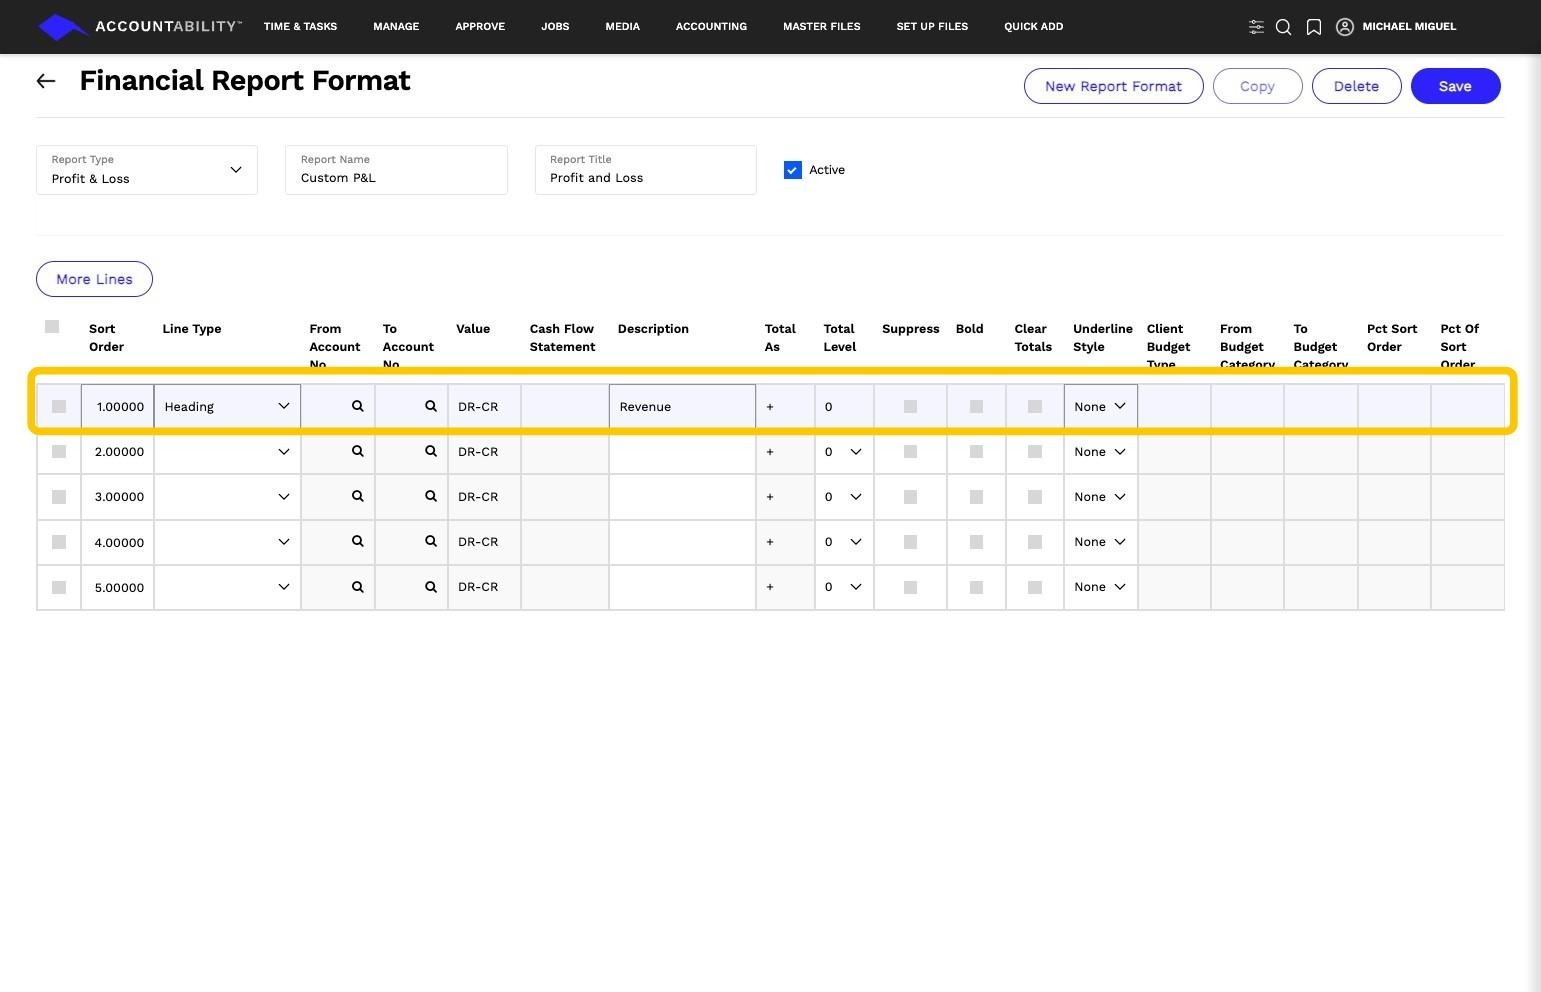
15. Report Setup
- Report Type: Profit & Loss
- Report Name: Custom P&L
- Report Title: Profit and Loss
- Active: Checked
16. Sort Order 1 – Heading
- Description: Revenue
- Purpose: Creates a main section heading for revenue.
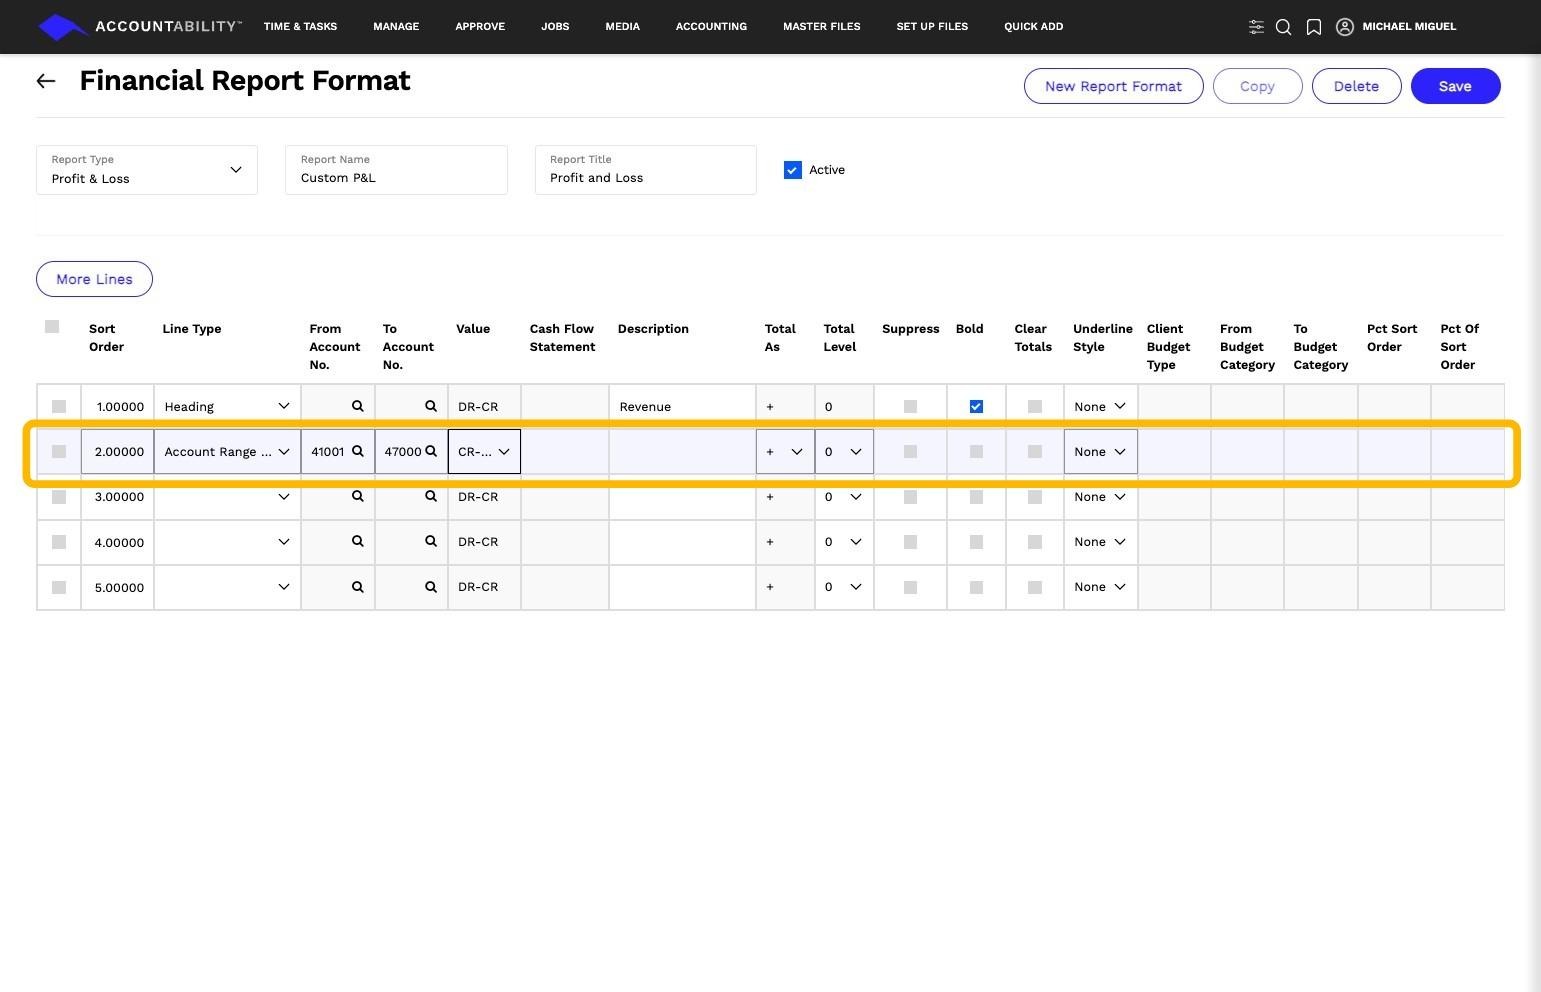
17. Sort Order 2 – Account Range
- From Account: First GL account in the revenue category.
- To Account: Last GL account in the revenue category.
- Value: Cr - Dr (Displays revenue as credit minus debit).
- Purpose: Pulls in all revenue accounts within the specified GL range.
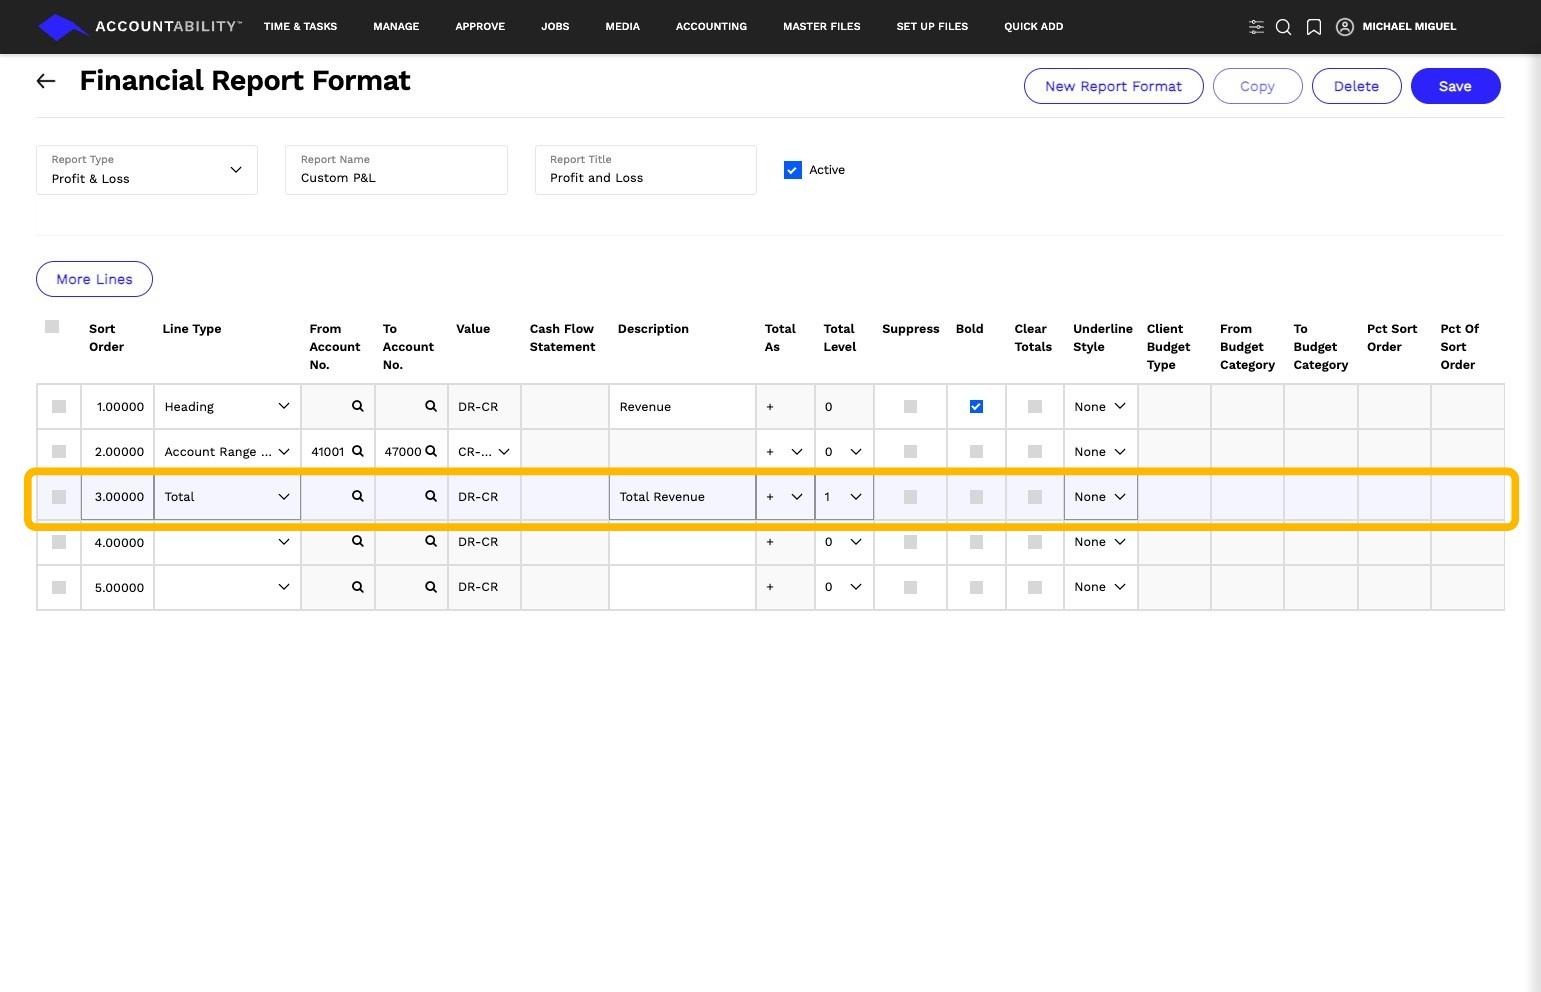
18. Sort Order 3 – Total
- Description: Total Revenue
- Total As: 1 (Summarizes all revenue lines above).
- Purpose: Calculates the total revenue for this section.
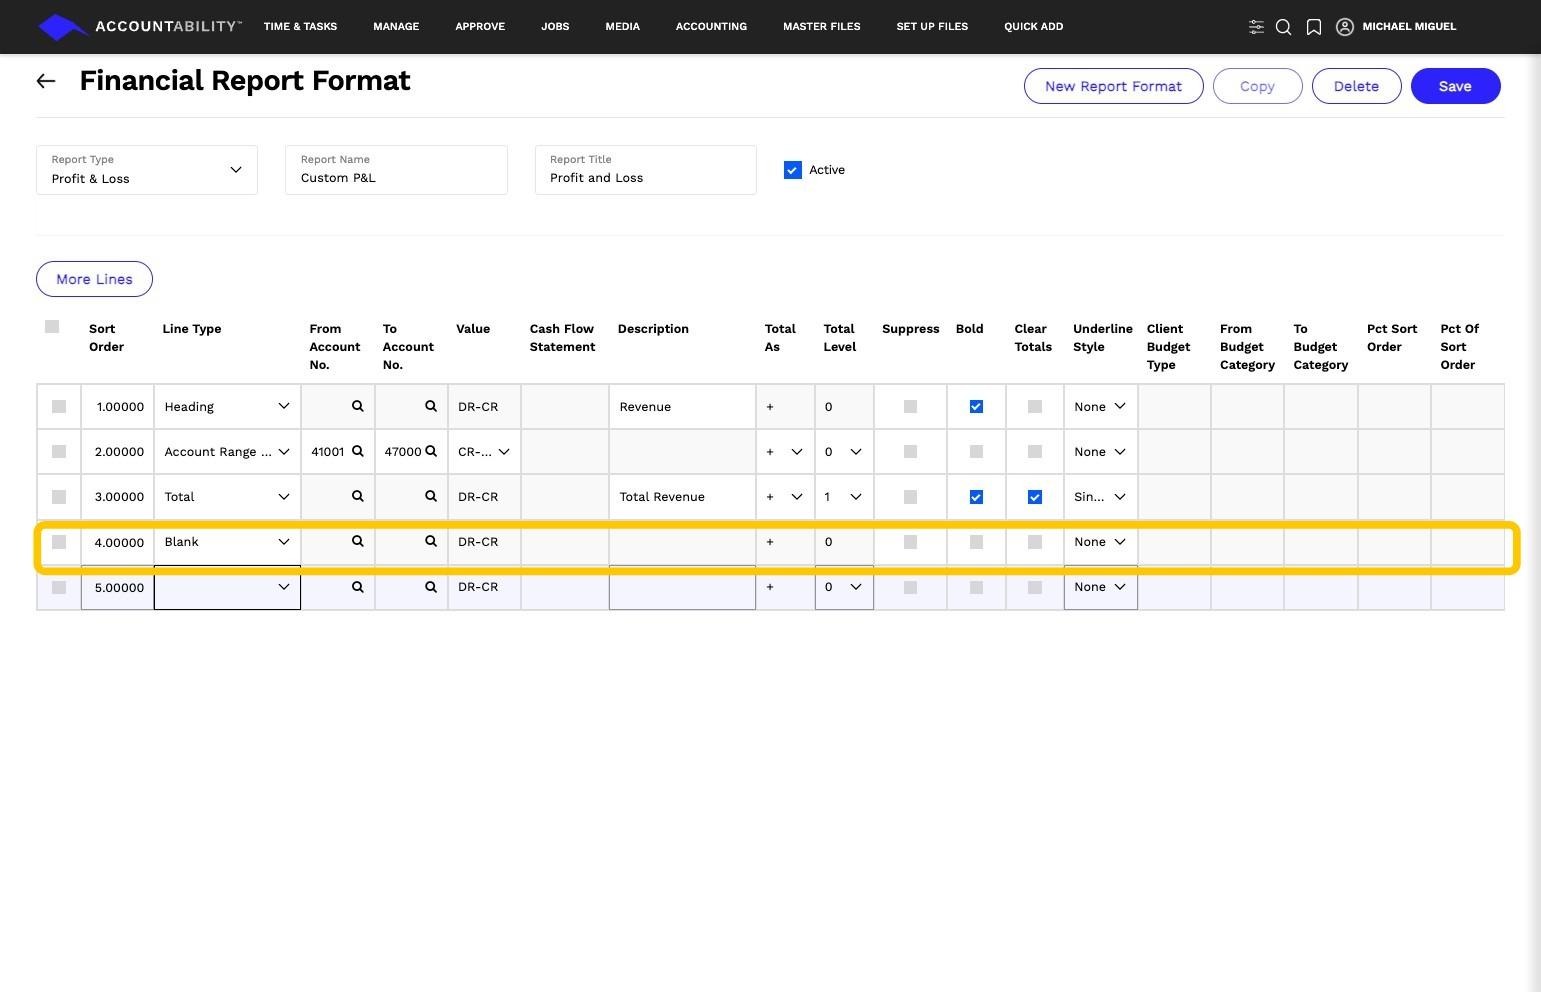
19. Sort Order 4 – Blank
- Purpose: Adds a blank space for visual separation.
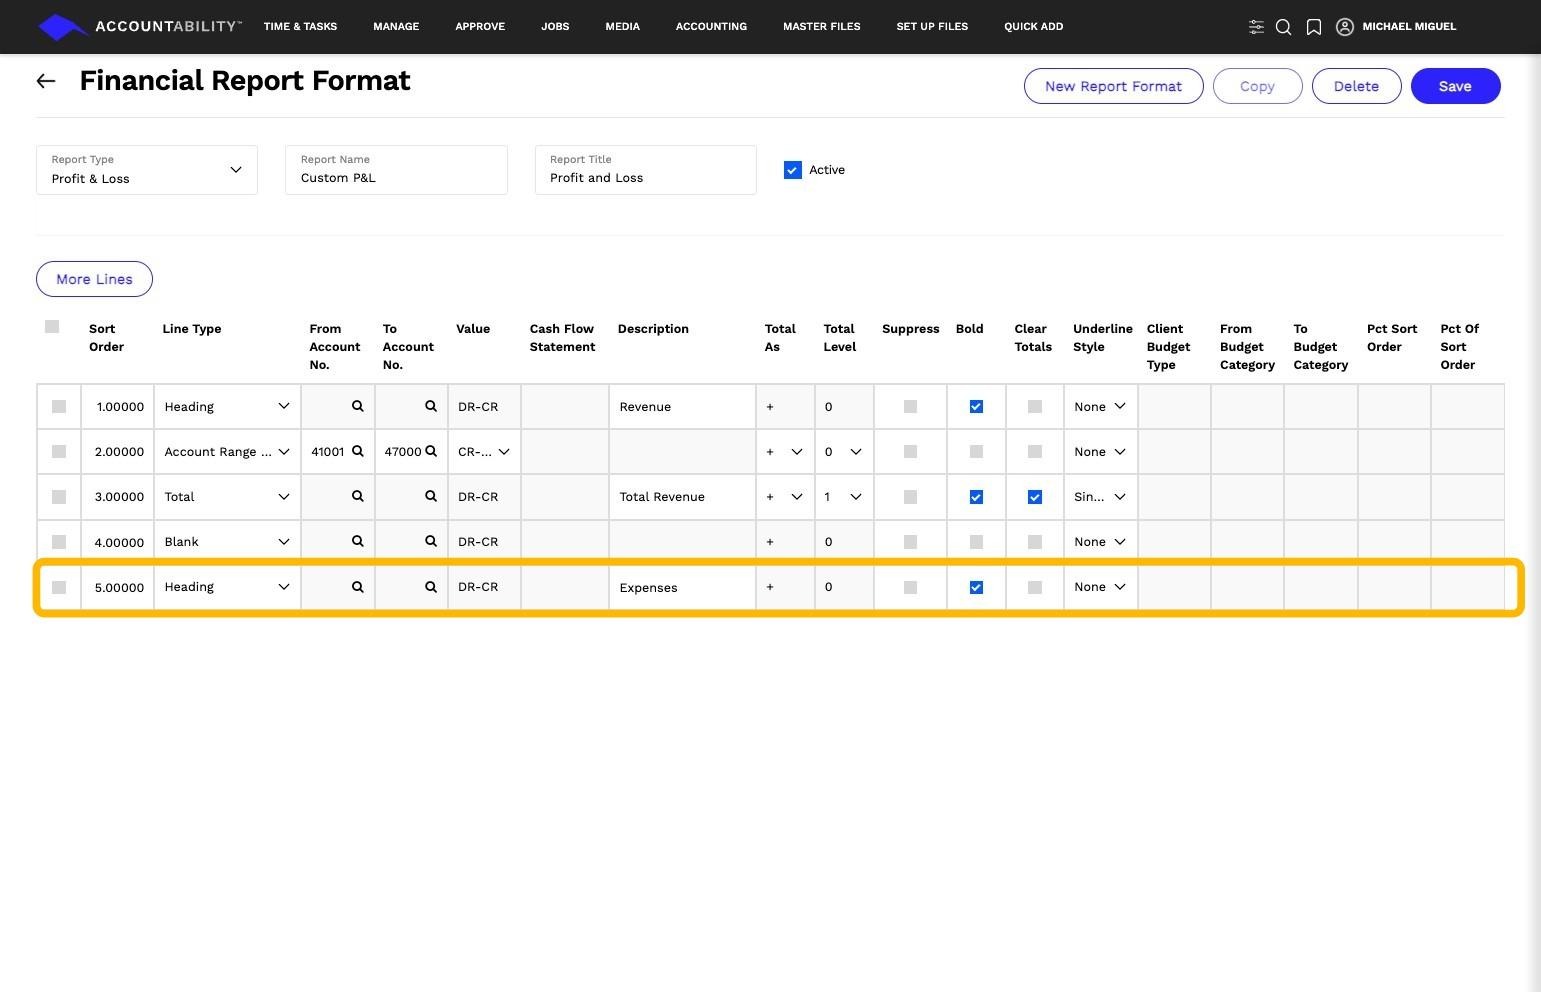
20. Sort Order 5 – Heading
- Description: Expenses
- Purpose: Creates a main section heading for expenses.
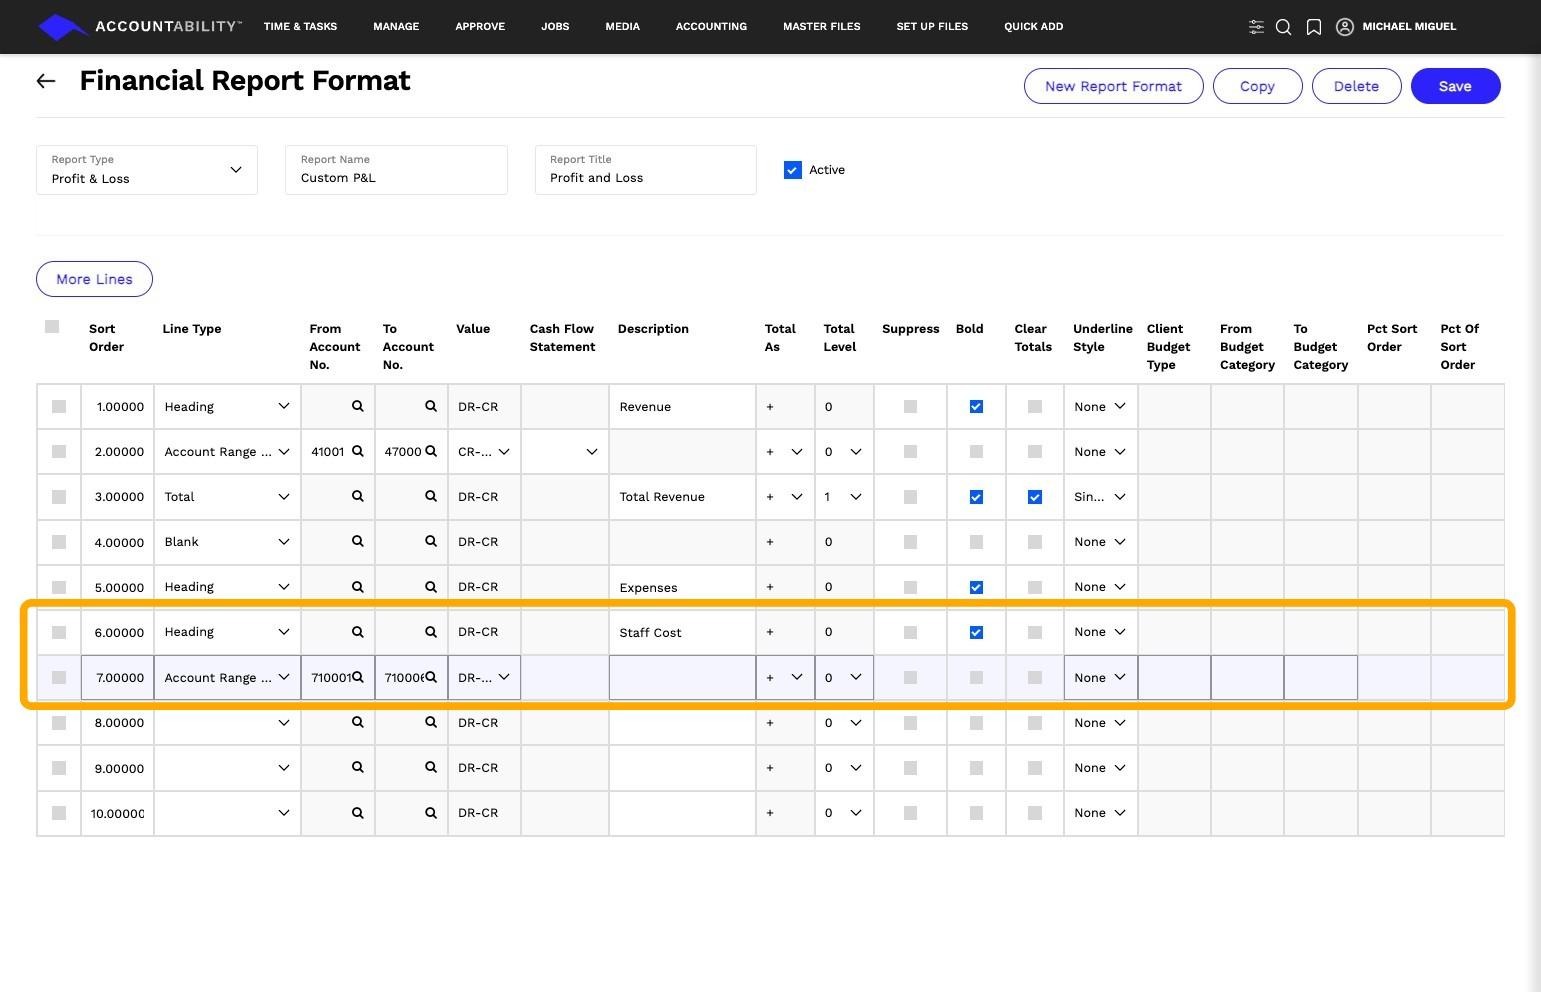
21. Sort Order 6 – Heading (Subheading for Staff Costs)
- Description: Staff Costs
- Purpose: Adds a subheading for staff-related expenses.
Sort Order 7 – Account Range (Staff Costs)
- From Account: First GL account for staff costs.
- To Account: Last GL account for staff costs.
- Purpose: Pulls in all GL accounts related to staff costs.
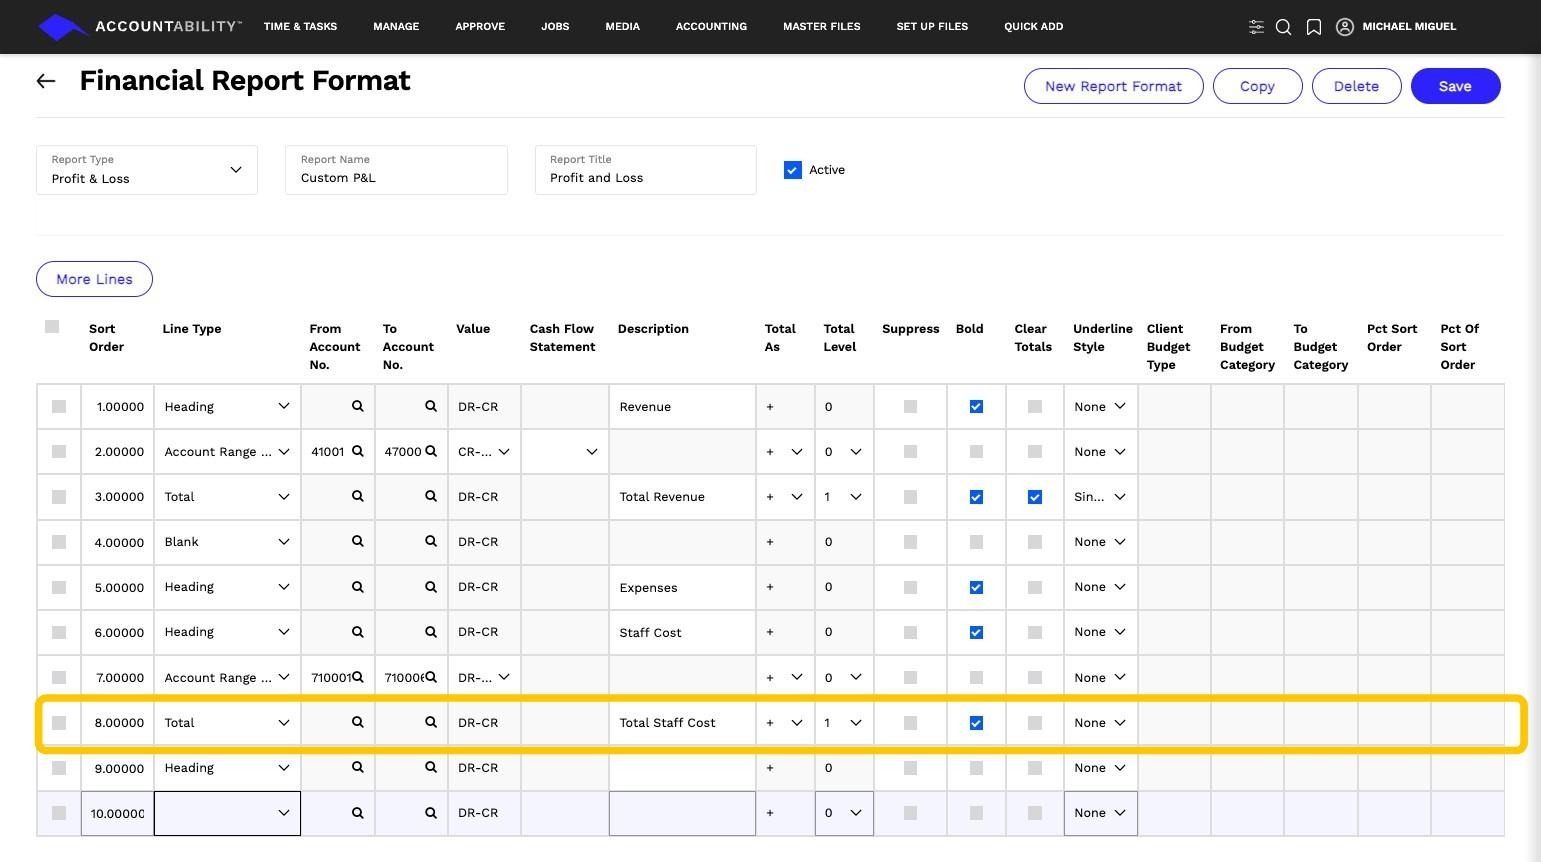
22. Sort Order 8 – Total (Staff Costs)
- Description: Total Staff Costs
- Total As: 1 (Summarizes all staff cost lines above).
- Purpose: Calculates total staff costs.
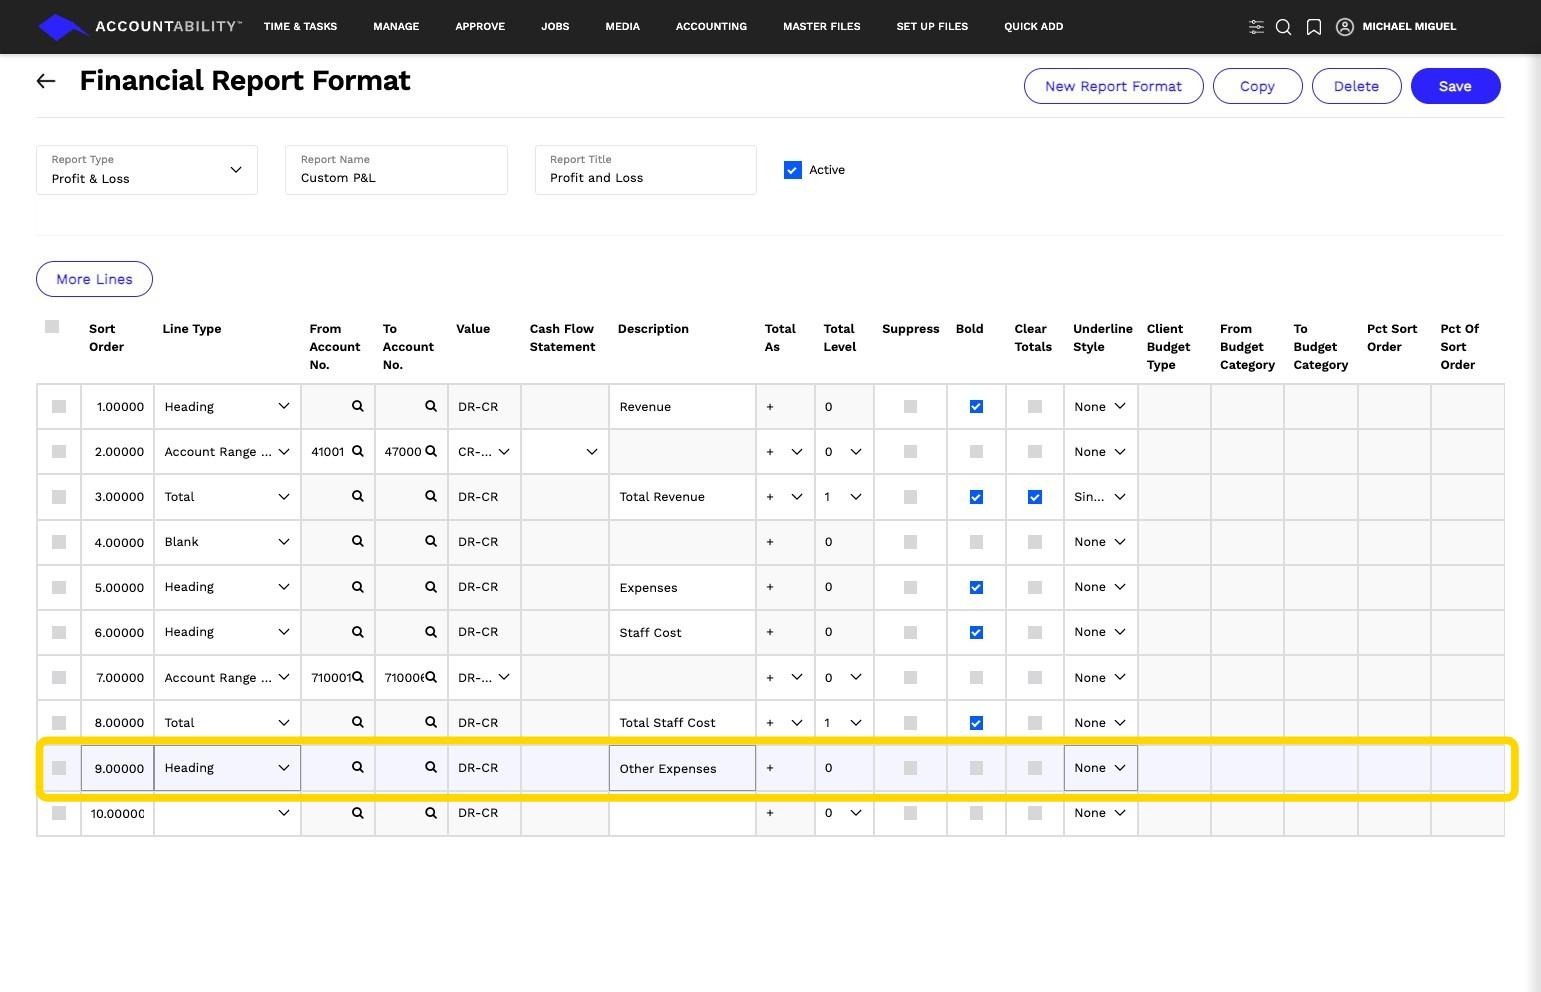
23. Sort Order 9 – Heading
- Description: All Other Expenses
- Purpose: Creates a section for non-staff-related expenses.
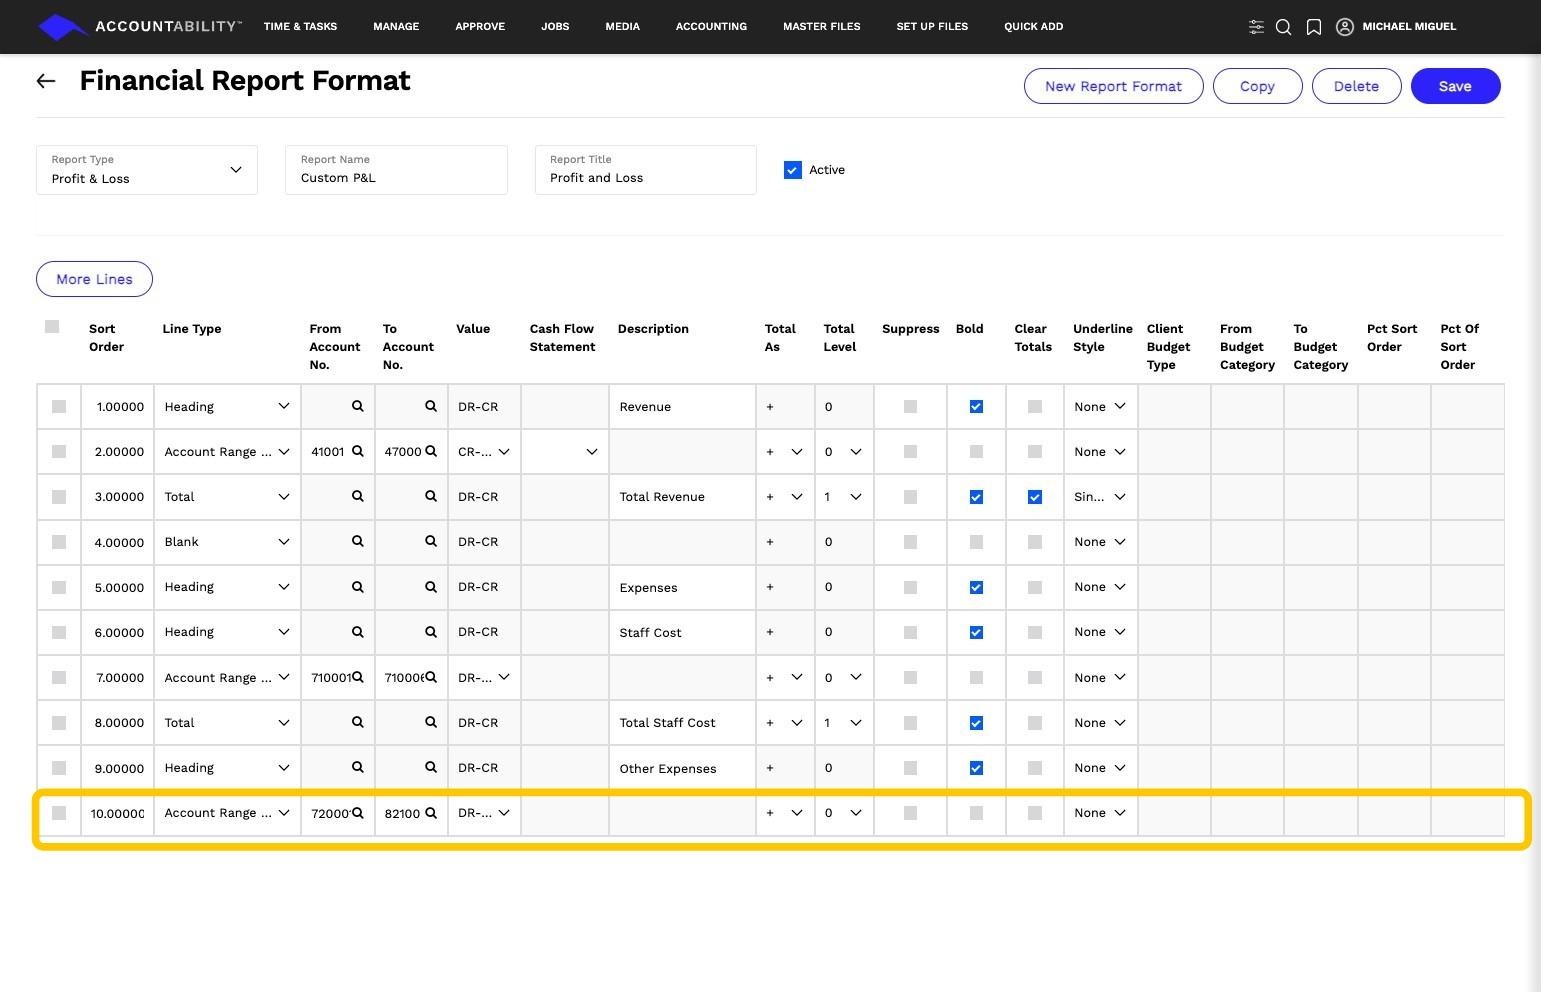
24. Sort Order 10 – Account Range (Other Expenses)
- From Account: First GL account for other expenses.
- To Account: Last GL account for other expenses.
- Purpose: Pulls in all other expenses into this section.
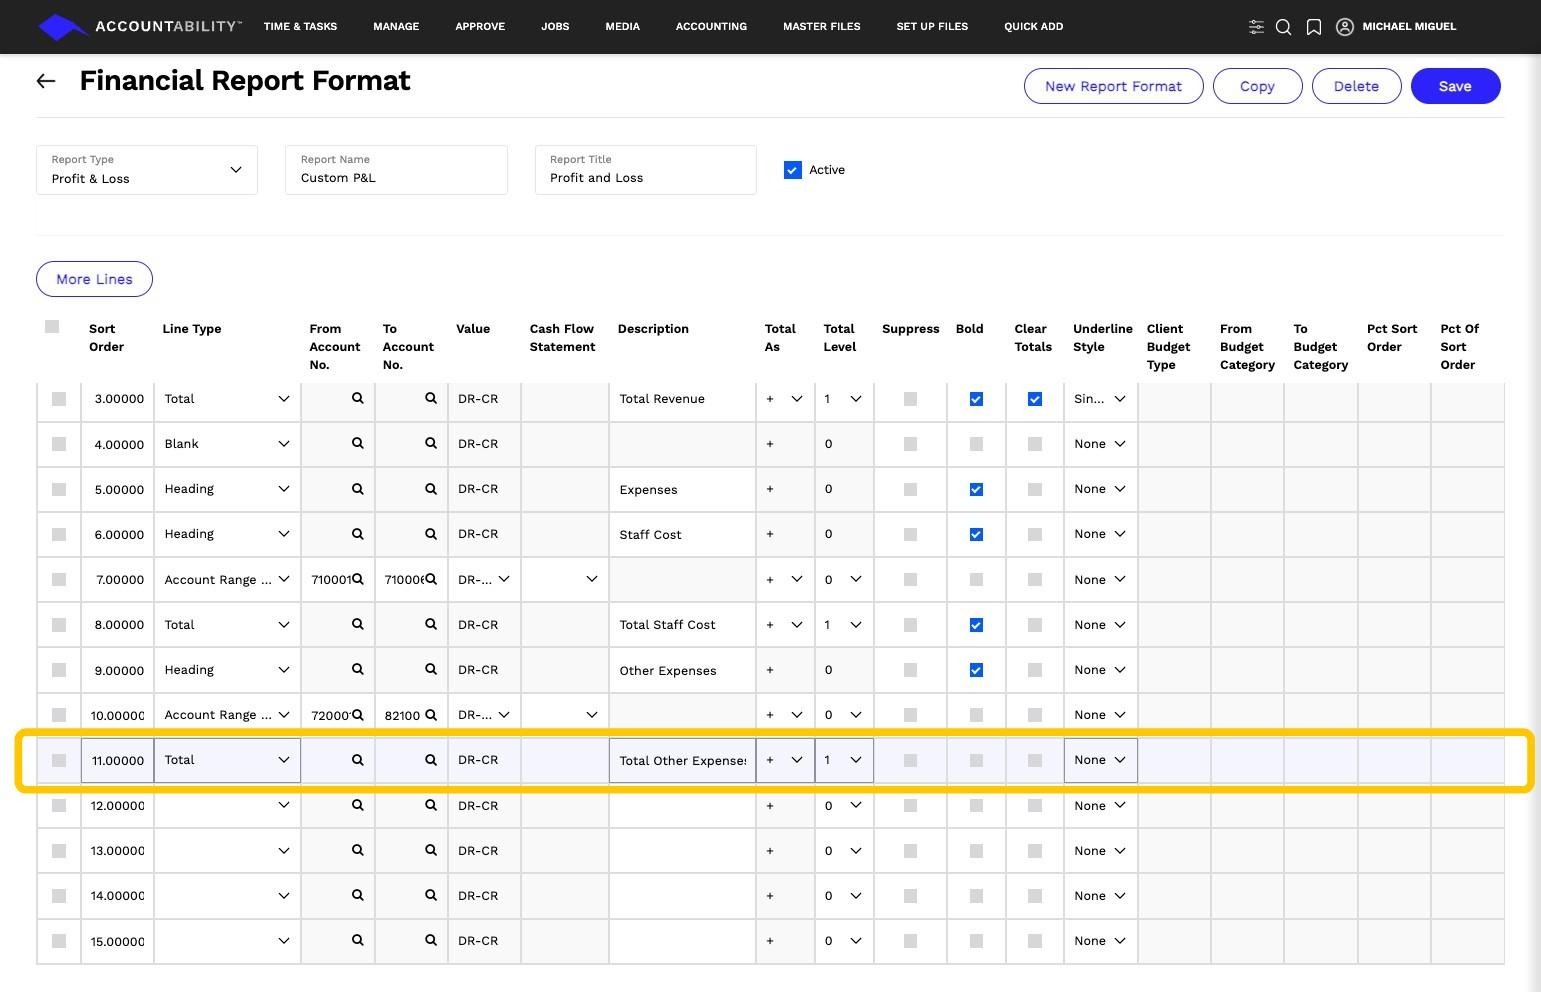
25. Sort Order 11 – Total (Other Expenses)
- Description: Total Other Expenses
- Total As: 1 (Summarizes all other expense lines above).
- Purpose: Calculates total for all non-staff expenses.
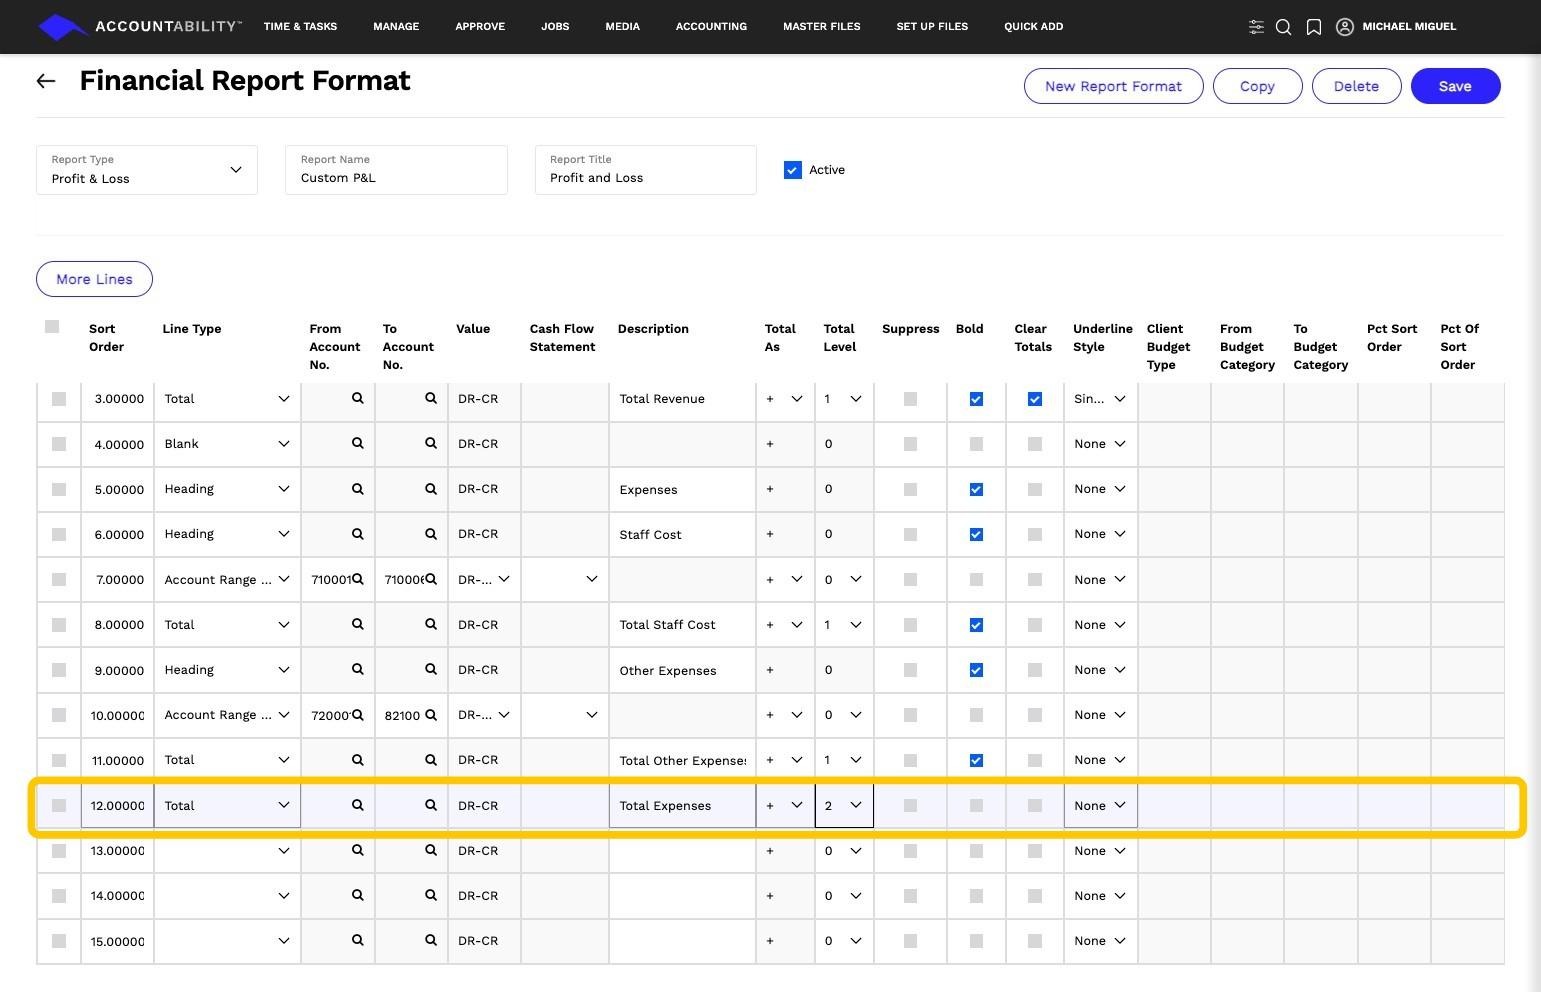
26. Sort Order 12 – Total (All Expenses)
- Description: Total Expenses
- Total As: 2 (Summarizes all expenses, including staff and other expenses).
- Purpose: Calculates the final total for all expenses.
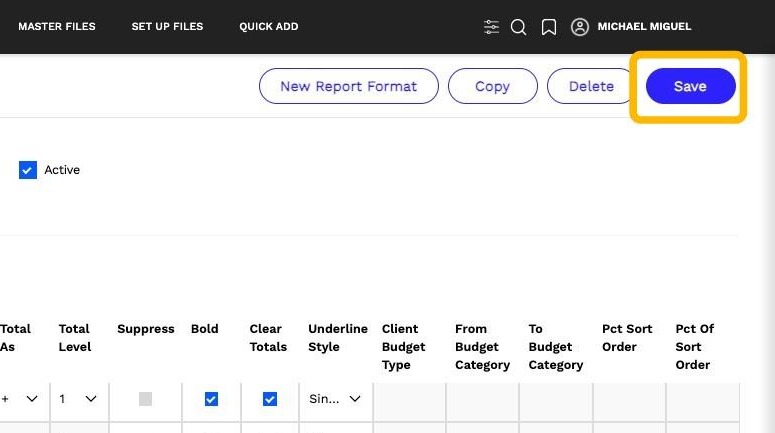
27. Save the Report
Once all line items are set up, click Save to finalize your Custom Profit & Loss report.
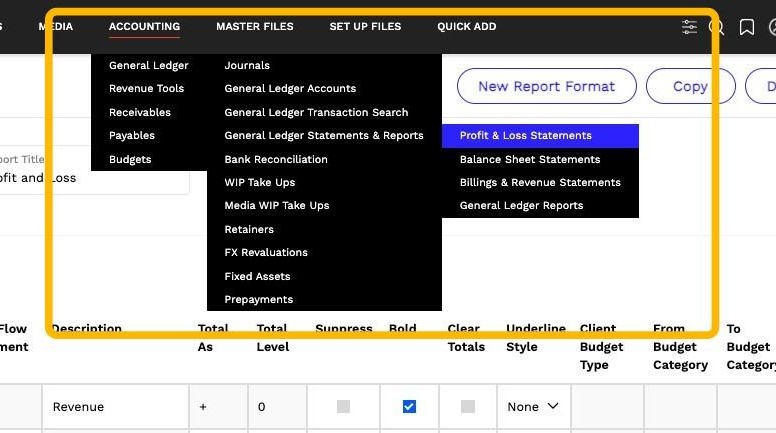
28. To view your custom report, navigate to General Ledger > General Ledger Statements & Reports > Profit & Loss Statement.
29. Click this dropdown.
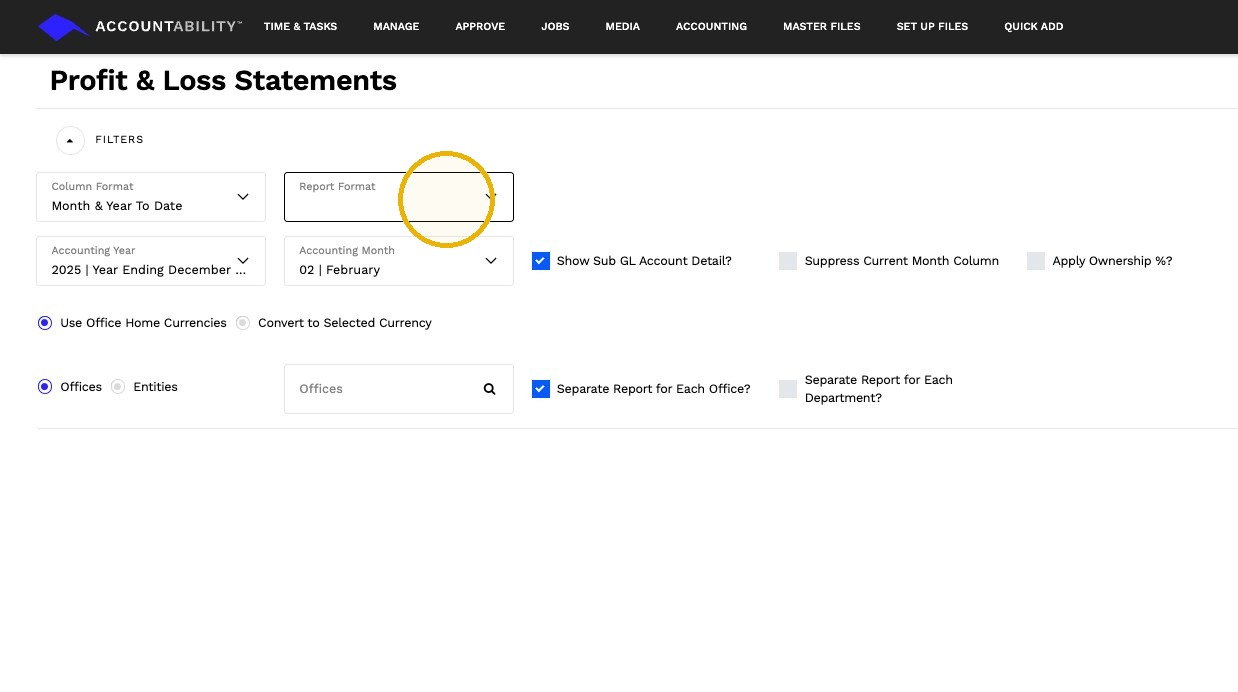
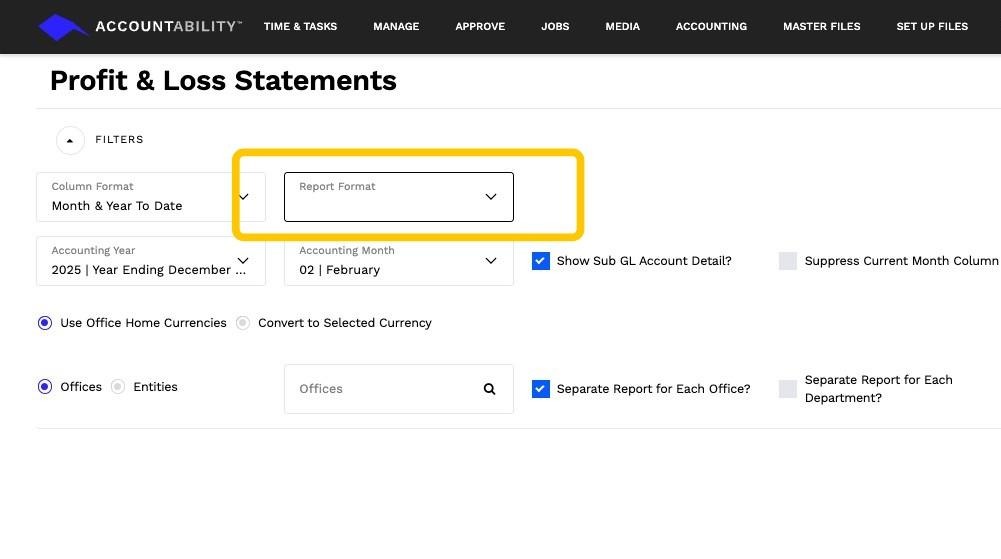
30. After selecting your column format, use the Report Format dropdown to choose your custom report. In this example, we named our custom report "Custom P&L."
31. Complete all the necessary account filters and options to customize your report settings before proceeding.
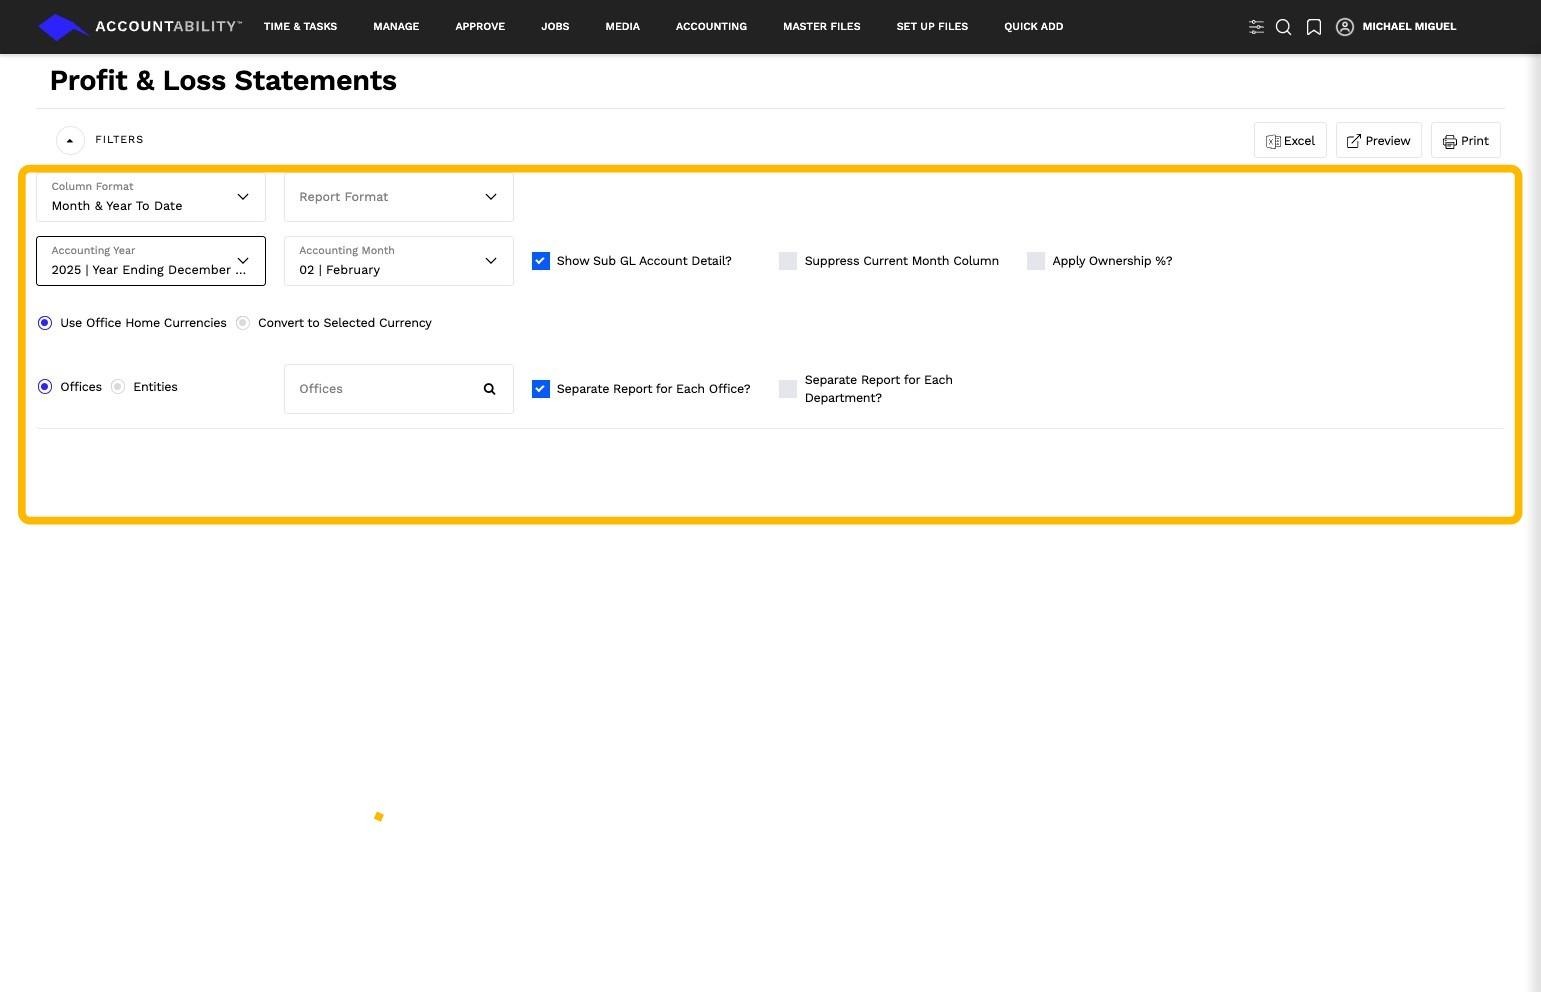
32. Click on Preview
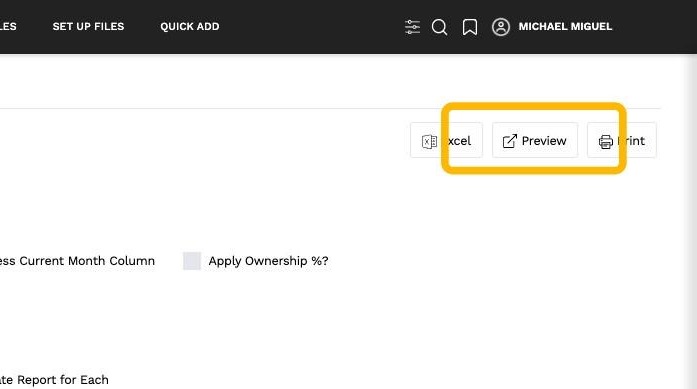
33. A preview of your custom report will appear. You can continue refining and adjusting the report settings to align with your agency’s specific needs.