![AccountAbility_logo_primary_fullcolor-1.png]](https://knowledgebase.counta.com/hs-fs/hubfs/AccountAbility_logo_primary_fullcolor-1.png?height=40&name=AccountAbility_logo_primary_fullcolor-1.png)
Step by Step Guide:
Tip: The Interactive Financial Statements follow the agency’s account structure and support custom reporting formats. Users can switch between P&L Statements and Balance Sheet Statements, apply filters, and analyze financial data efficiently.
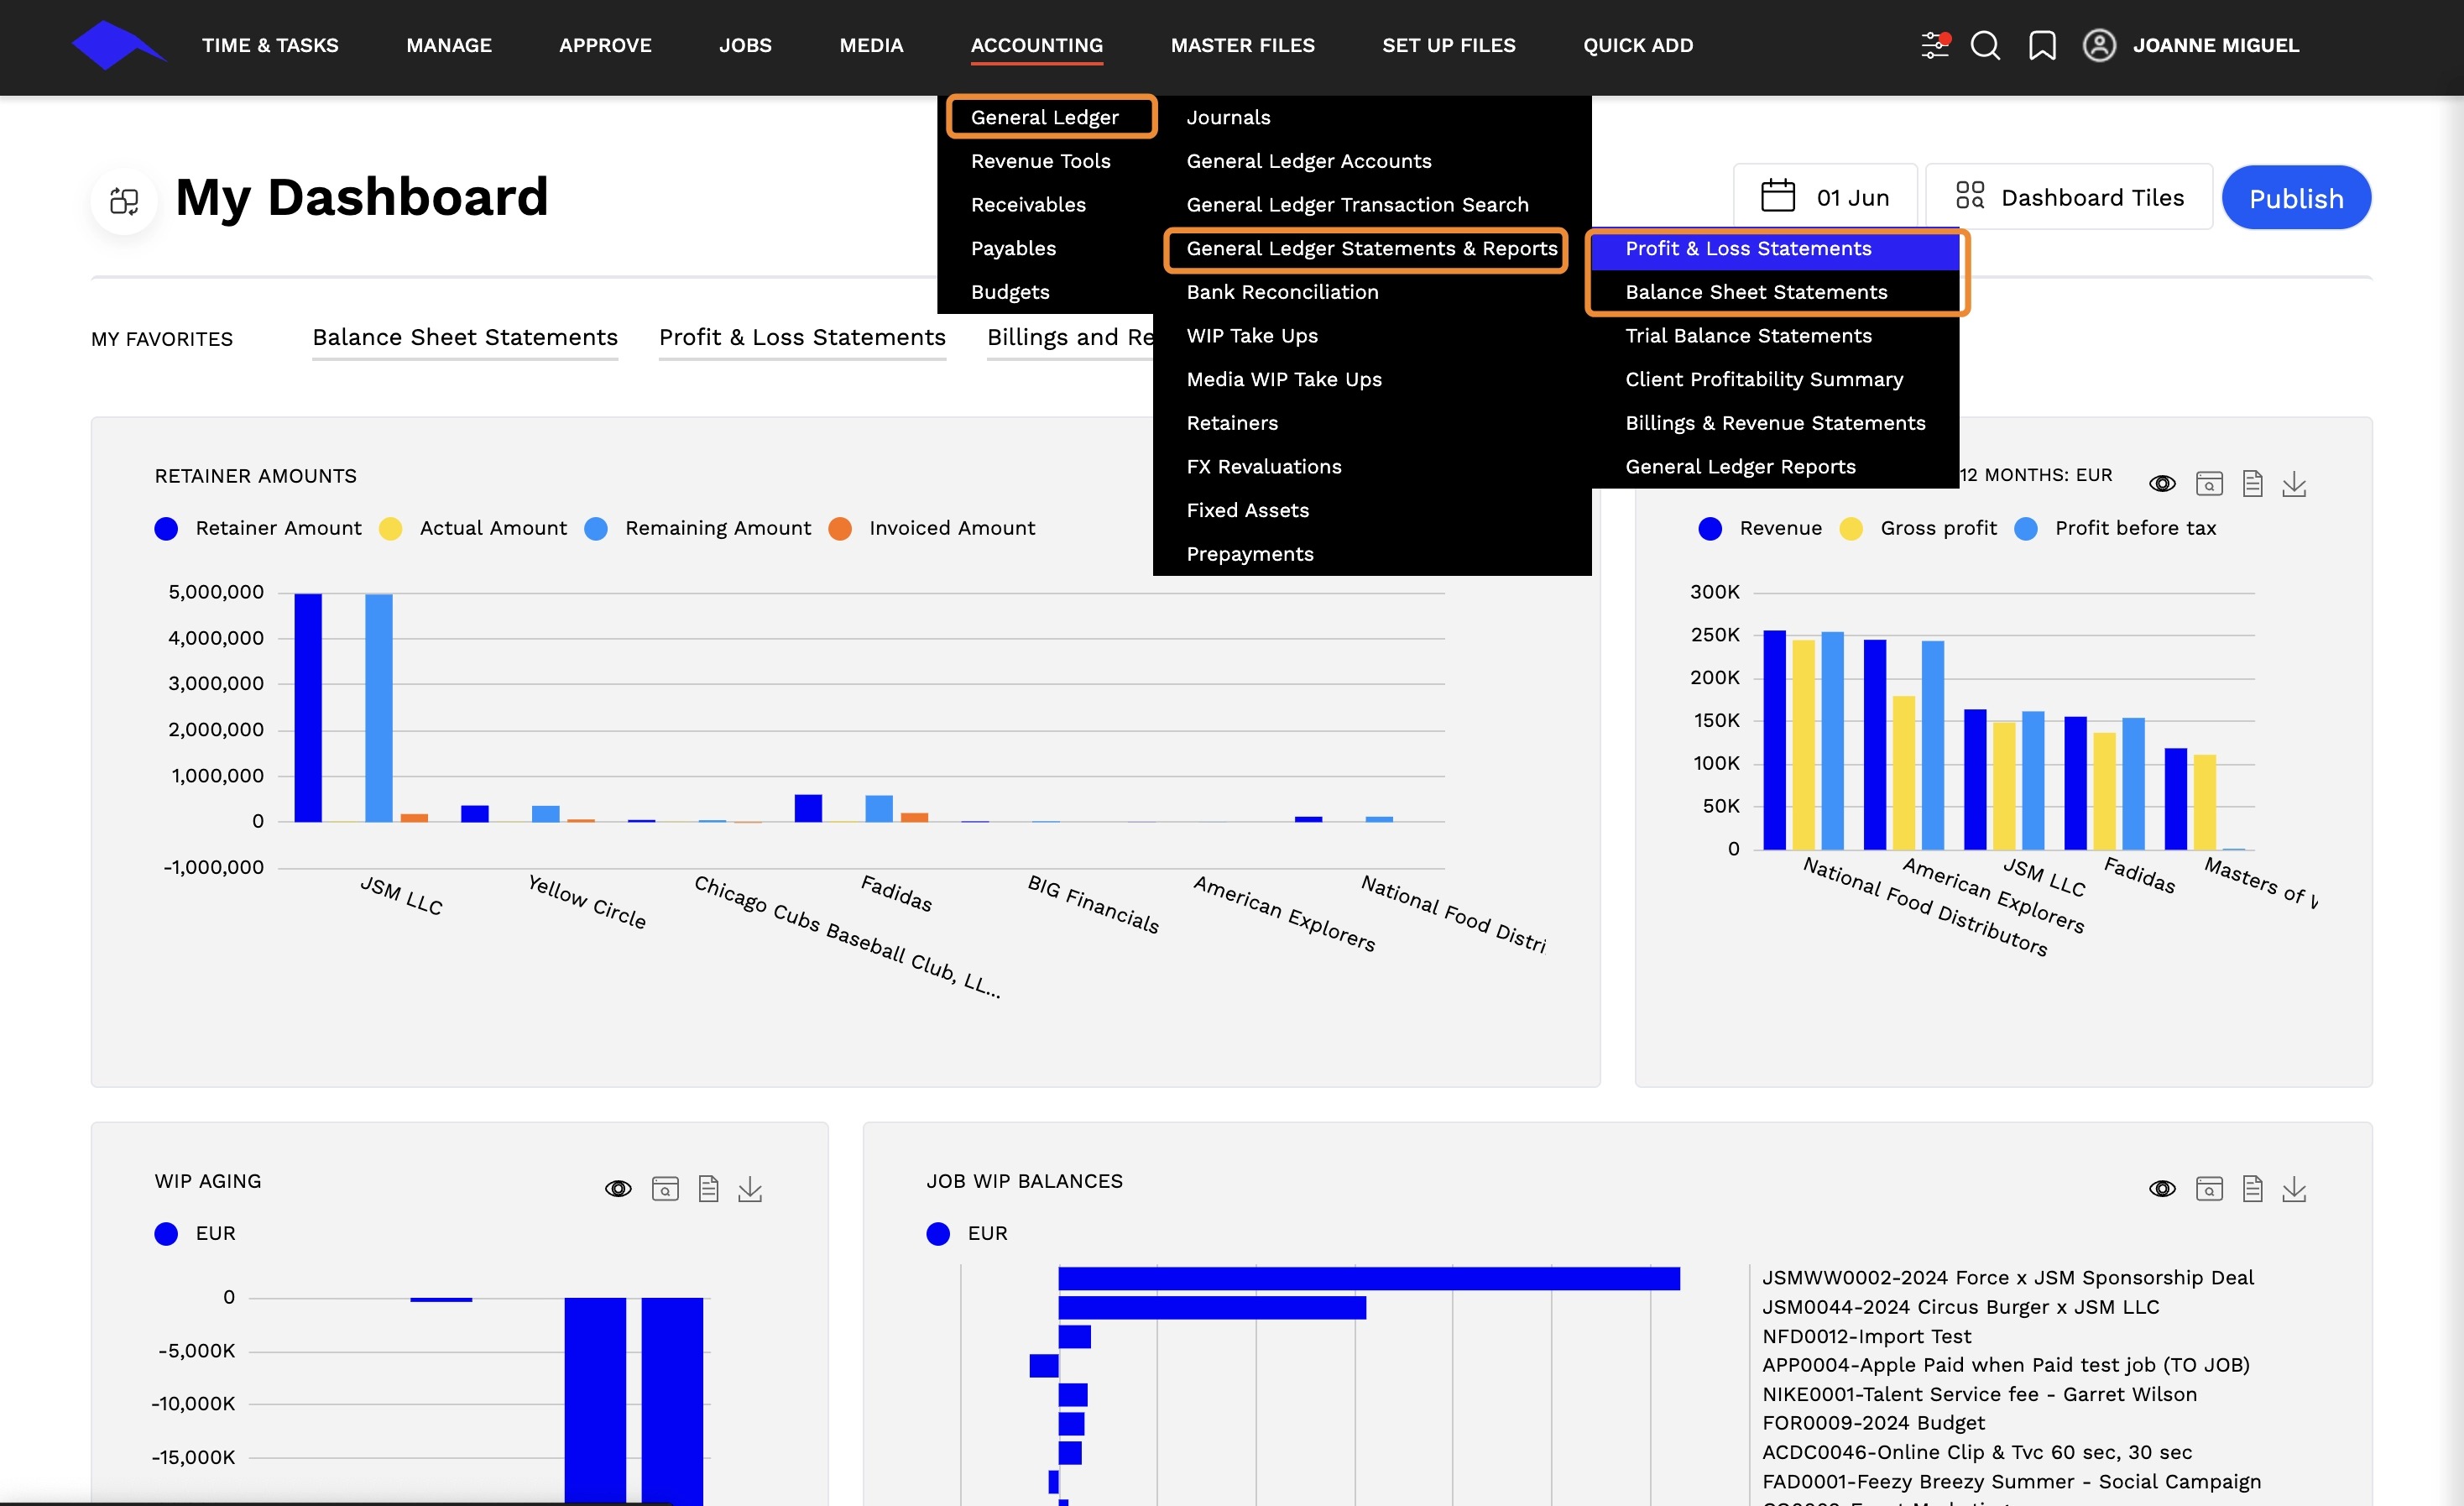
1. - Navigate to ACCOUNTING > General Ledger.
- Select Profit & Loss Statements or Balance Sheet Statements
2. Click Column Format and select from the list of standard views, e.g. Month and YTD, Monthly, and various comparative views.
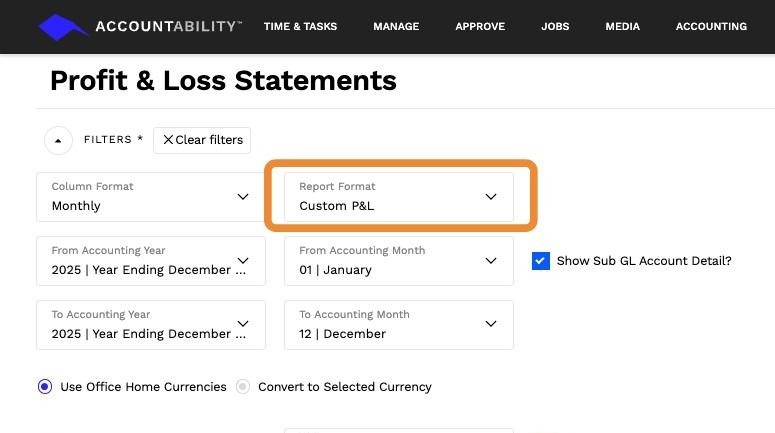
Tip: (Optional) Choose a custom Report Format based on the intended audience. This allows agencies to tailor the presentation of financial statements for different stakeholders. Cash Flow Statements can also be created through this function.
To learn more about Custom Financial Statement Format, click here:
https://knowledgebase.counta.com/knowledge/financial-statement-formats
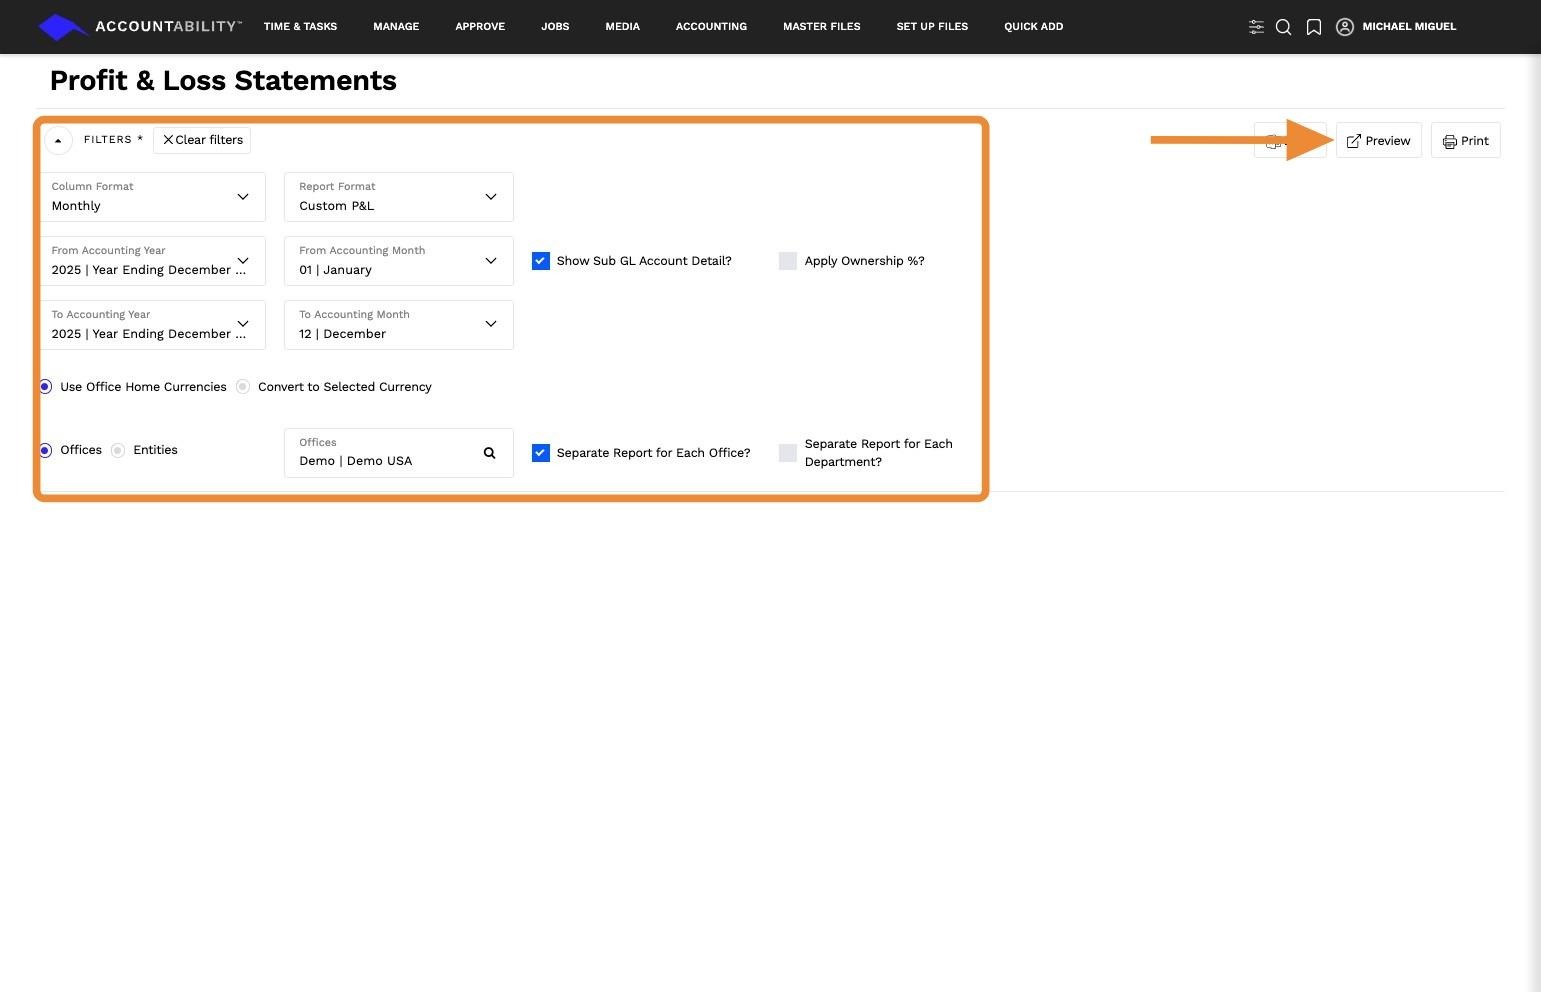
3. Apply the relevant filters and click Preview
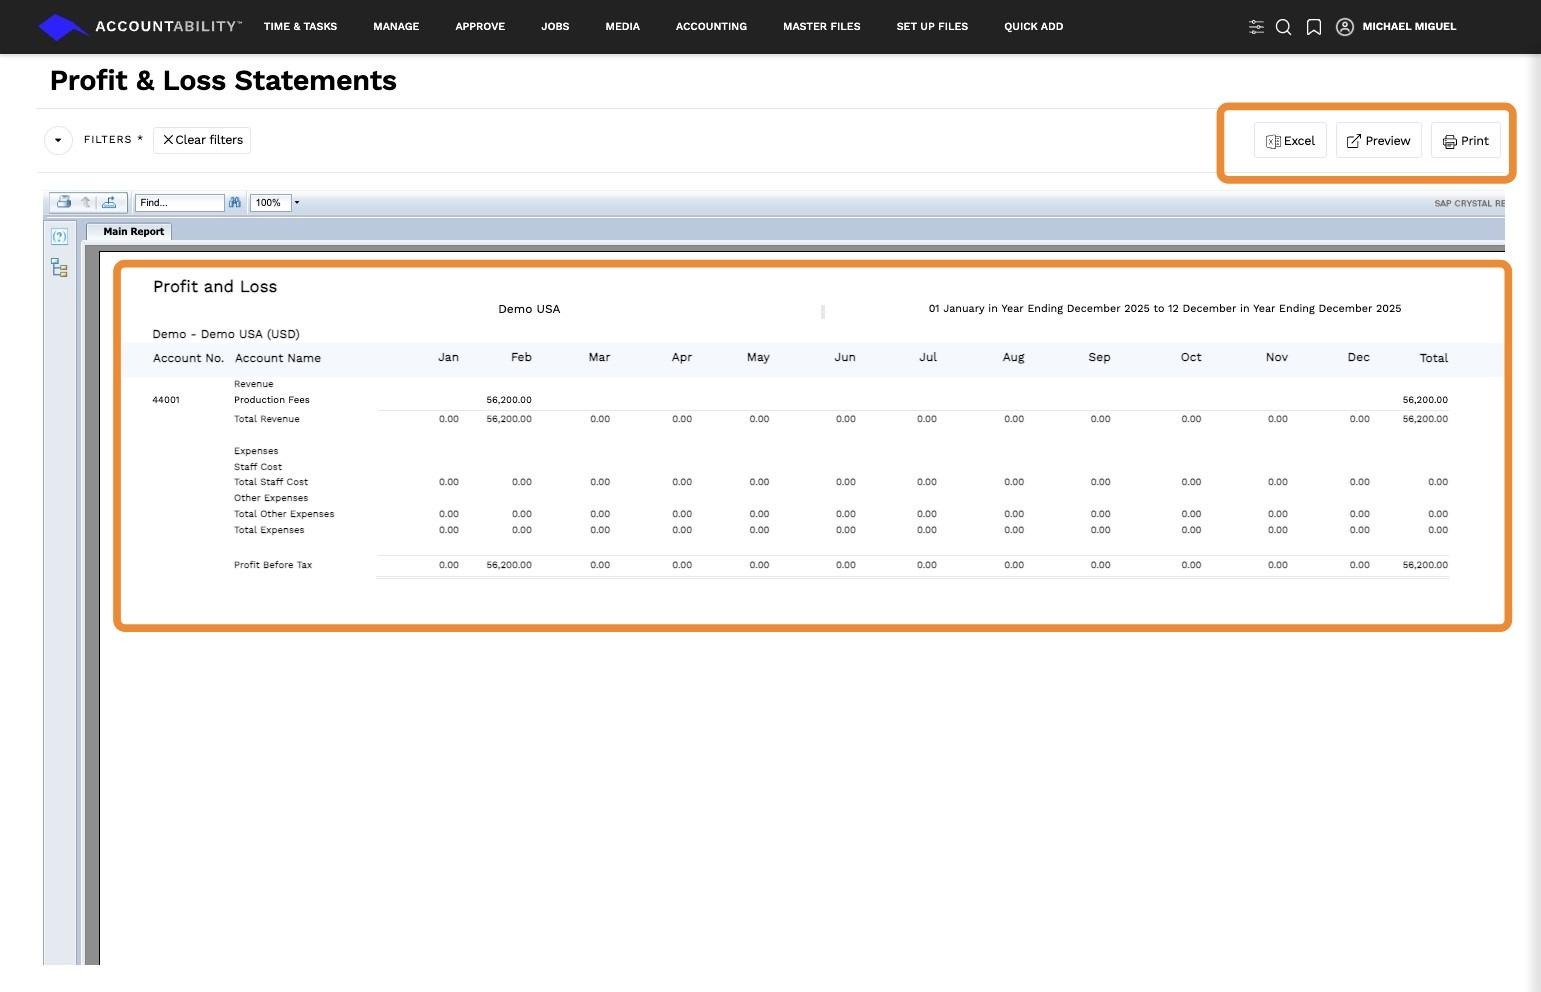
4. The interactive financial report will be displayed on a new screen.
Users can print or save the report as a PDF.
Drilling Down into Transactions
5. Users can quickly access detailed transaction data for any amount in the financial statement.
6. Click on the amount to view the Transaction Page, or right-click on the amount to open it in a new window.
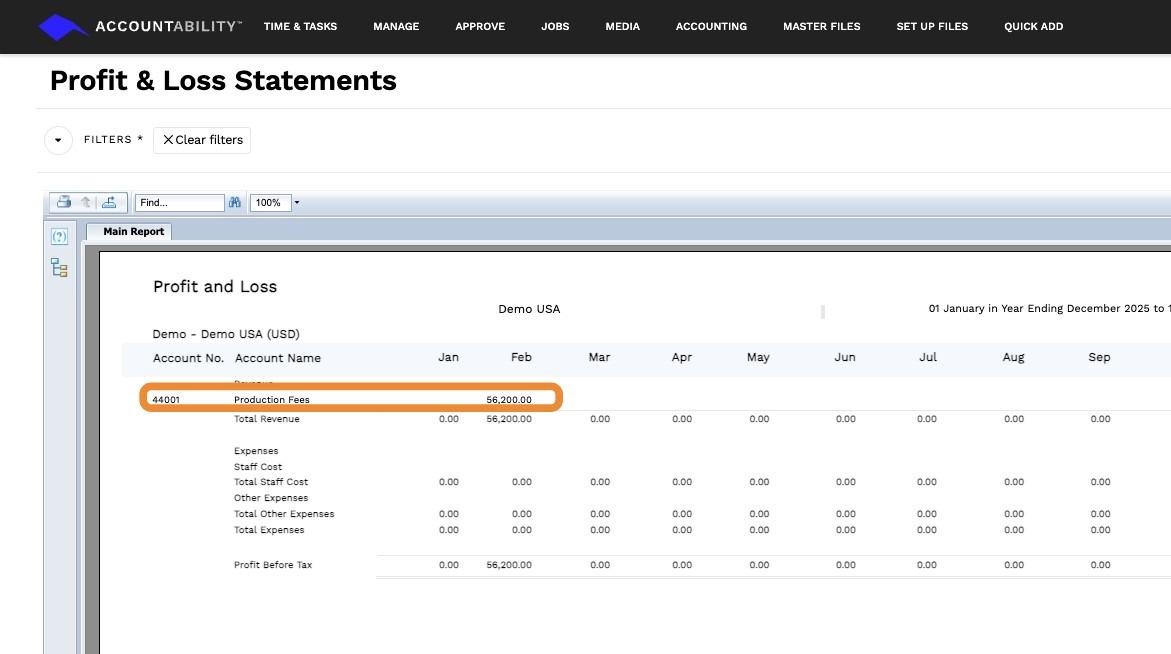
7. The General Ledger Transaction Details will be displayed based on the selected report filters.
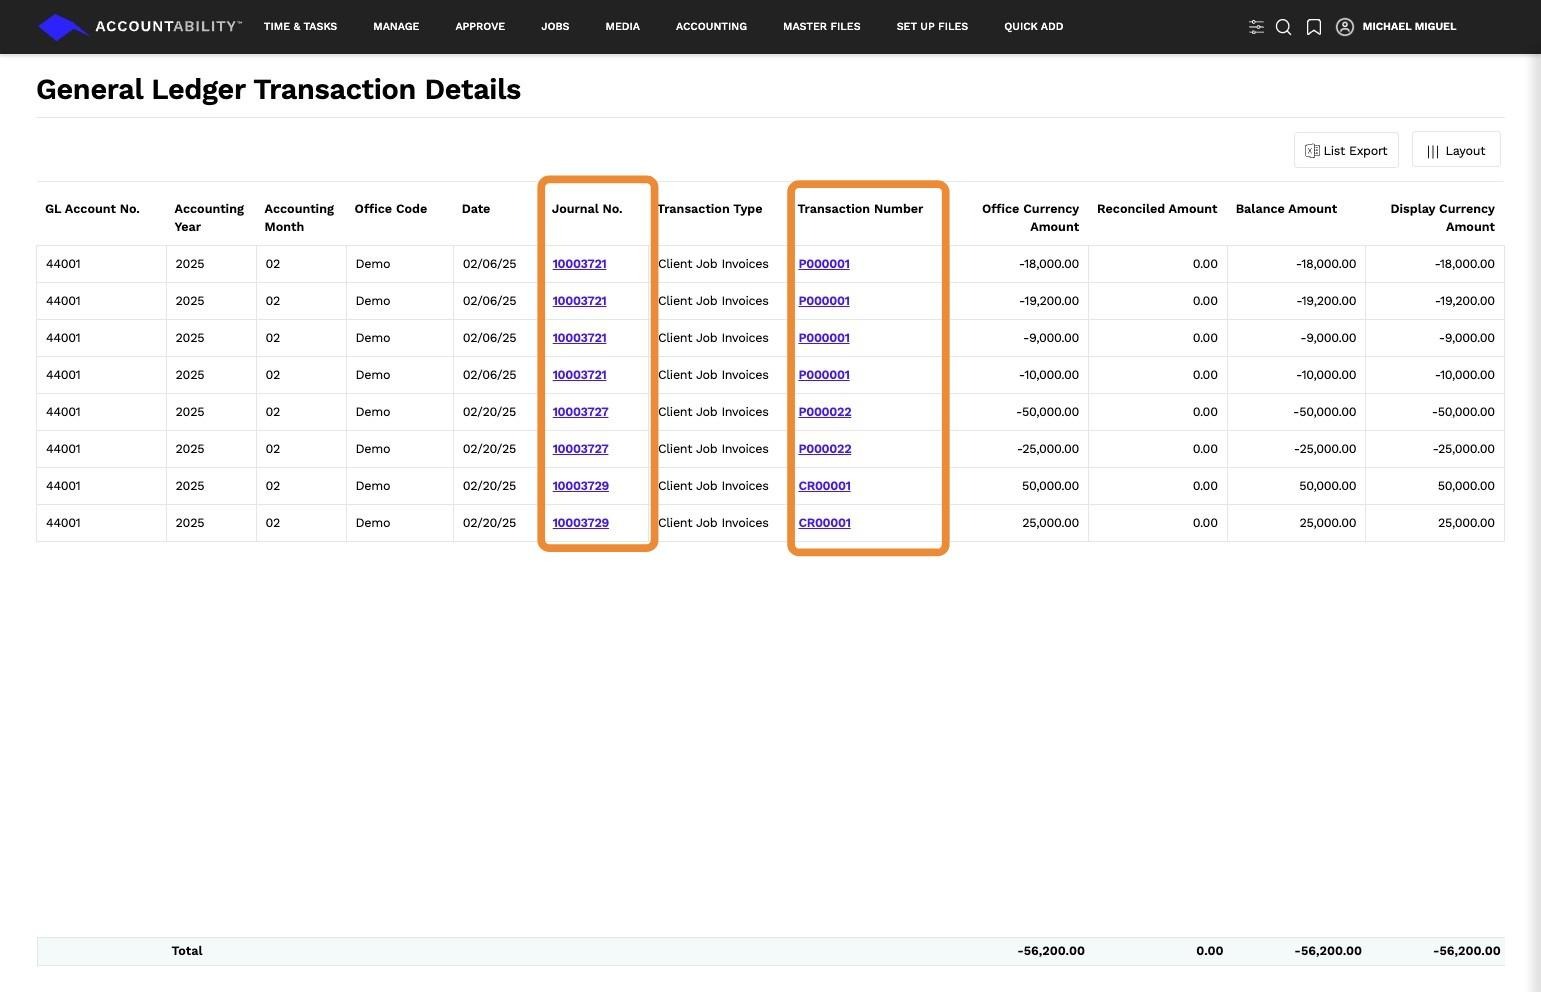
8. Blue hyperlinks in the report allow users to drill down into the journal entry, or transaction number providing direct access to system-generated transactions.
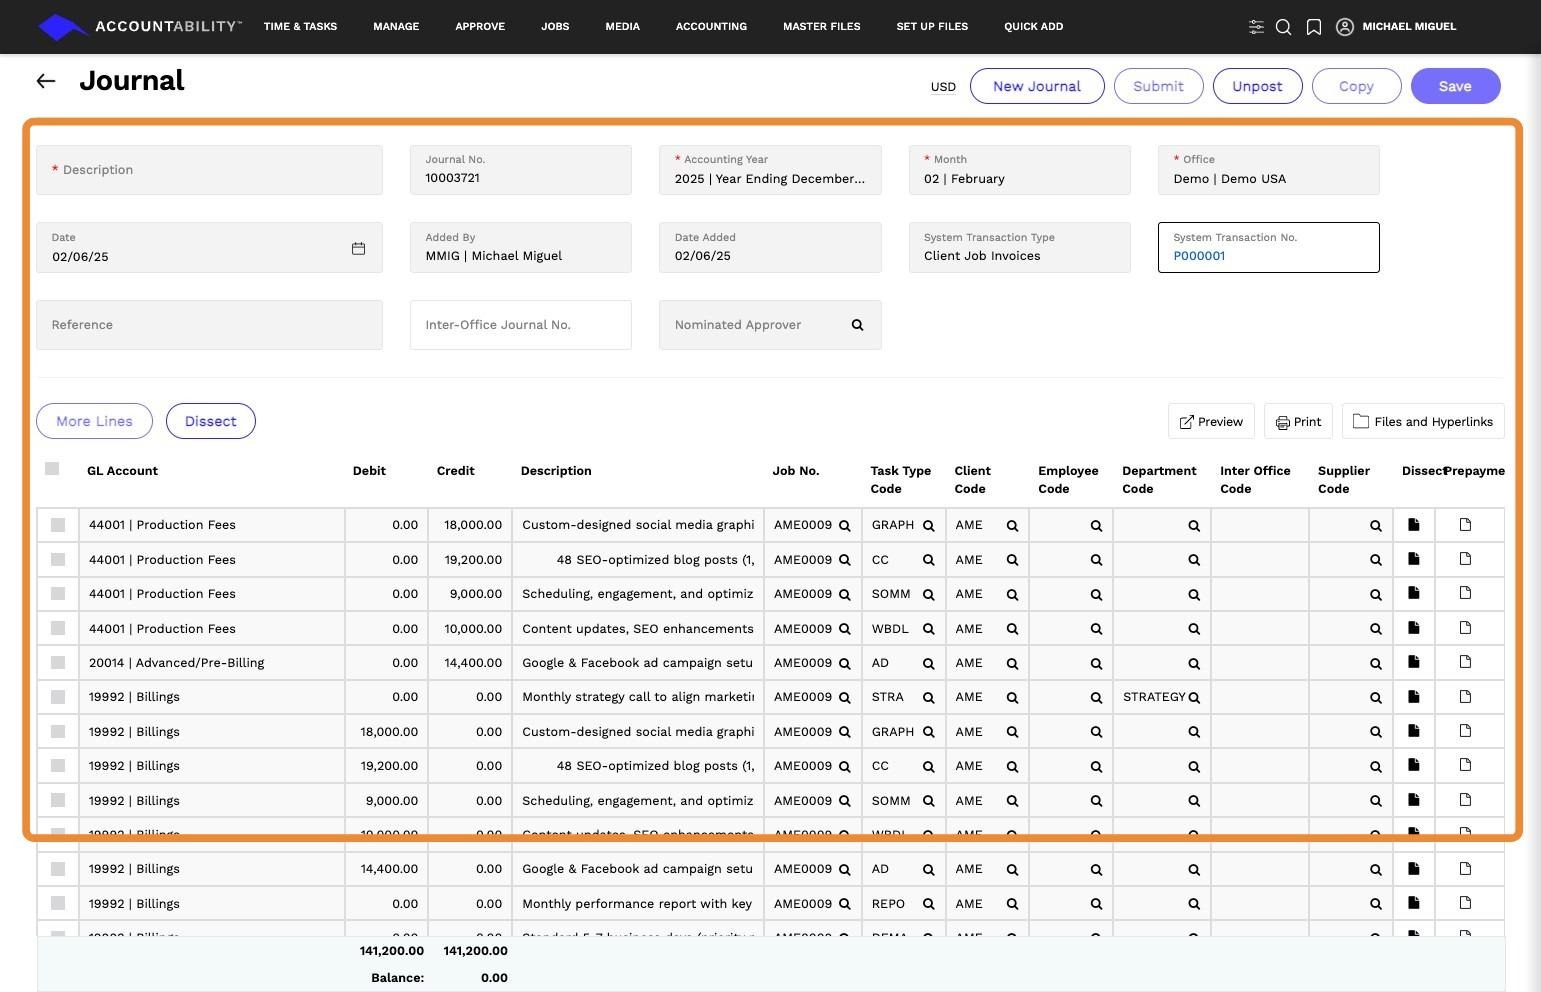
9. The Interactive Financial Statements offer a streamlined way to analyze financial performance, customize reports, and access transaction details efficiently. By leveraging drill-down capabilities and flexible report formats, users can gain valuable insights without running multiple reports.